Hello :)
If you've ever wondered why I use the 6hr chart instead of the 4hr chart, well it's because of days like these. Look how accurate the 200 EMA is at pinning these bottoms.
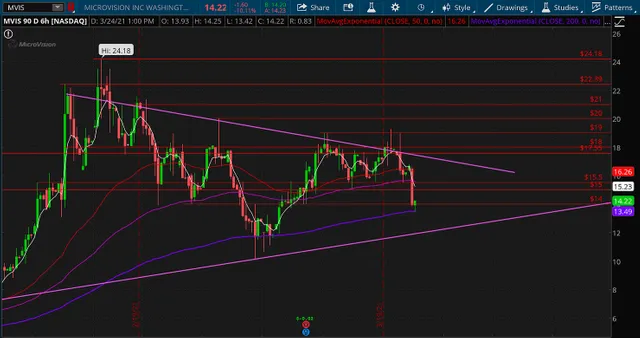
The RSI and the MACD happen to reveal very nice buy/sell triggers.
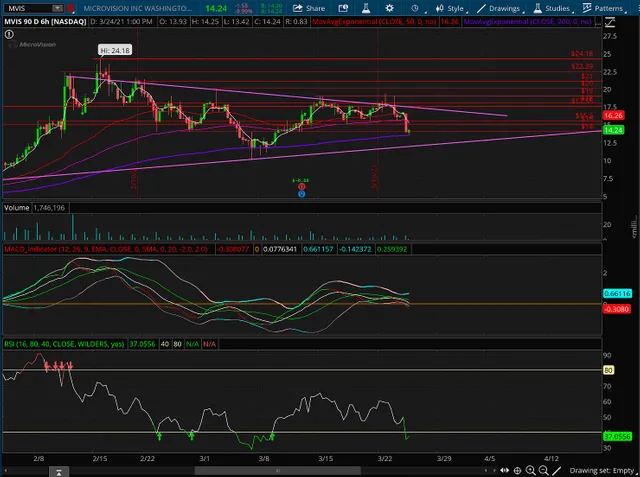
To me, it smoothens out a lot of what seems like indecisiveness on the 4hr chart. For example, here's the 4hr chart. Notice how the 200 EMA doesn't help at all. The RSI doesn't help here either cause we can go deep into oversold territory without seeing any sort of support.
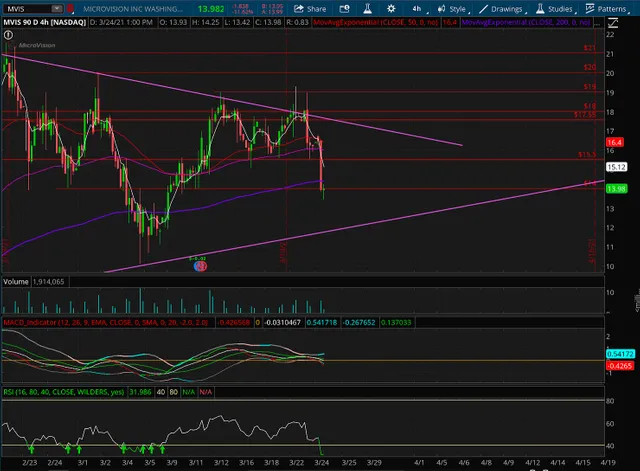
But how I view it, if the RSI starts getting oversold on the 6hr, it doesn't like being there at all, and this is where you buy. Same thing with the 200EMA. If it gets to the 6hr 200 EMA, this is a buy signal. As you saw in the first picture, only wicks make it below the 200 EMA and the price is immediately bought back up.
The success of this technique has been the case time and time again with this particular stock (MVIS). I have found that it applies to other stocks as well, but would require a little bit of time to observe as other timeframe's indicators may work better.
Now, let's overlay some other tools like the Fibonacci Retracement tool.
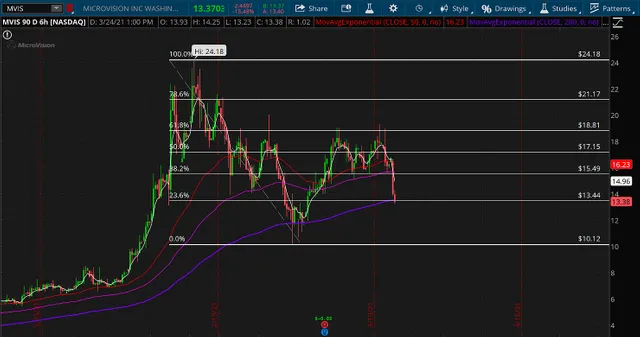
Notice that we are sitting on top of the 23.6% retracement level. Another support.
You also might notice that the 6hr 200 EMA lines up exactly with the daily 50 EMA. See below.
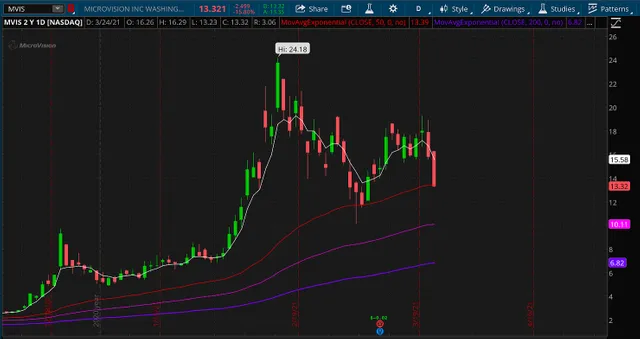
This alone shows you how reliable this bad boy is. Now, even if we reach below this support, within the timeframe of the candle (6hrs/1day), that is a lot of time for things to change. When they go below the EMAs, they will take the form of a wick if the price gets bought up.
A simple, yet incredibly effective approach.
Great post! Anybody who took your advice made some $$
Downvoting a post can decrease pending rewards and make it less visible. Common reasons:
Submit