Introduction:
The NASDAQ 100, one of the most closely followed and representative indexes of the technology sector, has demonstrated interesting seasonal patterns over the years. In this post, we explore how long-term trends can provide crucial insights for investors.
25-year analysis:
• Observation: looking at the NASDAQ 100 over a quarter of a century, we see a significant growth trend, punctuated by periodic corrections.
• Implication for Investors: a long-term view can help navigate market volatility, leveraging low periods for strategic purchases.
15-Year Analysis:
• Observation: over this timeframe, shorter cycles of growth and correction are noticeable, often influenced by global macroeconomic events.
• Implication for Investors: understanding global economic cycles can be key to anticipating market movements.
5-Year Analysis:
• Observation: over a shorter period, the impact of technological innovations and changes in consumer behavior become more evident.
• Implication for Investors: keeping an eye on emerging trends in the technology sector can offer timely investment opportunities.
1-Year Analysis:
• Observation: This brief period shows market responsiveness to specific news, like quarterly company results or political changes.
• Implication for Investors: An agile and responsive approach can leverage short-term fluctuations for quick gains.
Conclusion:
Seasonality in the NASDAQ 100 offers a window into market dynamics at various time levels. Investors who understand and respect these trends can strategically position themselves to make the most of market opportunities.

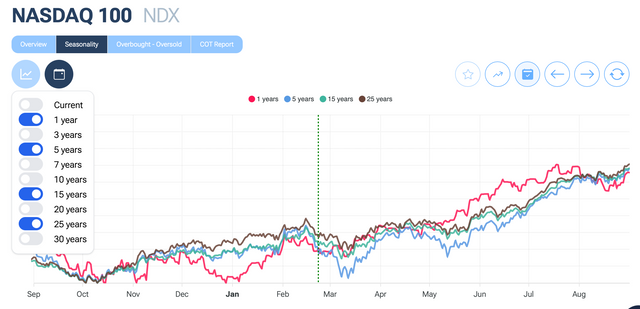
The chart represents the performance of the NASDAQ 100 over various periods: 25 years, 15 years, 5 years, and 1 year. This chart overlays market trends for each period, illustrating how seasonal analysis can provide significant data:
• Brown Line (25 Years): Shows an overall trend over a long period, useful for identifying major market trends.
• Green Line (15 Years): Represents an intermediate period, showing shorter cycles and reactions to macroeconomic events.
• Blue Line (5 Years): Indicates the impact of more recent factors, such as technological innovation and changes in consumer behavior.
• Red Line (1 Year): Highlights the market's reactivity to short-term news and events.
This type of analysis can be extremely useful for investors seeking to understand how various factors influence the market over time and how to position themselves accordingly.
