Intelligent acoustic emission online monitoring and fault diagnosis system based on Internet of Things and big data
2024-08-17 16:05
Xie Jiehui, Liu Yating, Liu Shifeng
QingCheng AE institute (Guangzhou) Co., Ltd
Abstract: Online (non-stop operation) tank bottom corrosion monitoring, crack monitoring of pressure vessels and other structures, pipeline valve leakage monitoring, bridge wire rope broken wire monitoring, wind turbine blade crack monitoring, wind turbine bearing amusement facilities, wear/damage/lubrication status monitoring of various rotating mechanical equipment, tool wear and other machining process monitoring, and other online monitoring and fault diagnosis of various structures and equipment are hot topics in industry, national defense, and national economy, and are also technologies with great demand. With the rapid development of the Internet of Things, the Internet of Things acoustic wave (acoustic emission) monitoring and diagnosis technology that has emerged is a new technology for online monitoring and fault diagnosis of the above structures and equipment, and has been successfully applied in large numbers, demonstrating a strong prospect for wide application. This article reports and introduces the principles of the Internet of Things acoustic wave (acoustic emission) technology, the Internet of Things acoustic wave (acoustic emission) monitoring and diagnosis equipment, and the application solutions and practical application cases of online monitoring and fault diagnosis of structures and equipment.
Keywords: sound wave; acoustic emission; online monitoring; Internet of Things; structure and equipment case;
1 Principle of Internet of Things Acoustic Wave (Acoustic Emission) Technology
The Internet of Things Acoustic Wave (Acoustic Emission) system consists of an intelligent acoustic emission collector (sensor, preamplifier, embedded data acquisition, embedded analysis software, communication), cloud platform, and client. First, the acoustic emission sensor collects the acoustic emission signal from the monitored object (tank bottom plate, pressure vessel, pipeline valve, bridge wire rope, wind turbine blade, rotating machinery, tool machine, etc.), converts the tiny mechanical vibration signal into a voltage signal and transmits it to the acoustic emission data acquisition and analysis module (acquisition module). The acquisition module performs signal processing edge computing, and then sends the valid data to the cloud platform for further cloud computing processing through various networking communications, and outputs alarms or reports directly to the client mobile phone, or logs in to the cloud platform on the computer to view current/historical data.
Compared with the classic acoustic emission instrument, the IoT acoustic emission equipment system has the following characteristics:
A. The IoT acoustic emission equipment is an embedded Linux system, while the classic acoustic emission instrument is a Windows system. The former has the characteristics of long-term stable automatic operation and low cost and small size, while the latter relies on computers and cannot guarantee long-term stable automatic operation and has a large size and high cost.
B. The IoT acoustic emission system can realize online, remote, and unattended acoustic emission monitoring and detection, while the classic acoustic emission instrument cannot do these points. It requires technicians to operate the instrument on site and give results after detection and analysis.
C. The IoT acoustic emission system is a software that automatically analyzes and automatically gives results according to standards, while the classic acoustic emission instrument relies on technicians to rate.
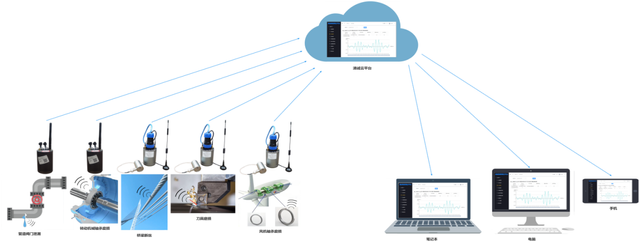
Figure 1 - RAEM system and application overview
2 Current status and key technical points of the Internet of Things acoustic wave (acoustic emission) monitoring and diagnosis system
2.1 RAEM series intelligent acoustic emission acquisition system
The RAEM module is an intelligent single-channel acoustic emission collector that integrates signal acquisition, signal analysis, and communication data output. After the collected signal is digitized by AD, the signal is subjected to frequency domain filtering, waveform processing, acoustic emission impact characteristic parameter extraction, and impact parameter evaluation and rating. The data is transmitted to the Internet of Things platform through the communication module built into the small cylinder, such as 4G, WiFi, network cable, etc.

Figure 2 - RAEM system flow chart
The following are several intelligent acoustic emission collectors that have been developed and their introduction:
Technical indicators RAEM1 RAEM2 RAEM1-6
Graphics
Number of channels Single channel or multi-channel networking Single Channel 2 to 36 channels or more
Sampling method Threshold or time trigger Time trigger Threshold or time trigger
Sampling rate/sampling accuracy 2M/16bit
Input frequency 10kHz-1000kHz 10kHz-400kHz 10kHz-1000kHz
Protection level IP62 IP62 /
System noise Better than 30dB Better than 30dB Better than 30dB
Dynamic Range 70dB 70dB 70dB
powered by 12VDC
or battery powered Built-in 3000mAh rechargeable lithium battery 12VDC
Operating temperature -20℃ to 60℃ -15℃ to 60℃ -20℃ to 60℃
sensor Built-in preamplifier sensor optional: 28V40dB, 12V34dB, 5V26dB Built-in sensor, 28V40dB Built-in preamplifier sensor optional: 28V40dB, 12V34dB, 5V26dB
AE characteristic parameters Amplitude, Energy, RMS, ASL, Ring Count, Rise Time, Duration Amplitude, Energy, RMS, ASL Amplitude, Energy, RMS, ASL, Ring Count, Rise Time, Duration
Waveform have have have
Communication method (others can be customized) 4G, Ethernet, WiFi, RS485 4G, Bluetooth 4G, Ethernet, WiFi, RS485
Clock synchronization Single channel: no synchronization clock
Multi-channel GPS wireless synchronization clock accuracy: better than 1uS
Multi-channel WiFi wireless synchronization clock accuracy: better than 10uS Single channel without synchronous clock Wired synchronous clock: better than 10uS
The Qingcheng big data platform expression, mobile phone alarm push, and smart phone patrol interface are as follows:
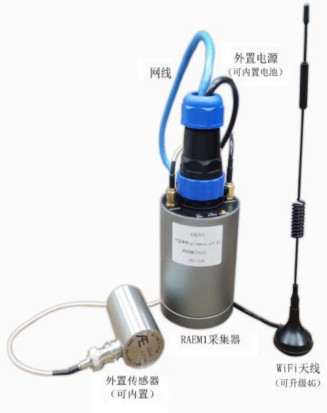
Figure 3 - Big Data Cloud Platform Figure 4 - Mobile phone alarm Figure 5 - Mobile phone inspection
2.2 System automatic calibration mechanism
As a long-term monitoring product, the calibration of the acoustic emission system cannot rely on people going to the site to give standard signals such as lead breaking like traditional acoustic emission instruments, because this method is very unfriendly, especially in some field scenes, it is very troublesome for people to go to the site, which is very time-consuming and labor-intensive.
Therefore, the system automatic calibration mechanism, namely sensor automatic calibration, is developed, which refers to a technology that emits pulse mechanical signals under voltage excitation by sensors and receives them through adjacent sensors to evaluate the sensitivity and coupling of the received sensors. RAEM can be configured with sensor automatic calibration (AST) function, with two sensors, one transmitting sensor and one collecting sensor. The transmitting unit circuit board outputs a low-level pulse control IO signal through an external controller, and controls the switch circuit to output a pulse voltage signal to the transmitting unit piezoelectric element. The transmitting unit piezoelectric element will output a weak mechanical vibration signal accordingly due to the reverse effect of the piezoelectric effect; the mechanical vibration signal is transmitted to the collecting unit piezoelectric element through the surface of the object to be measured, and is converted into an electrical signal due to the piezoelectric effect, and then collected by the collecting unit circuit board. The received signal strength and energy are used to judge whether the receiving end sensor is well coupled and whether the system is normal. The whole process is completed automatically by the system or by remote operation, which is very effective for automatic calibration of long-term monitoring systems. Its structure and transmitting circuit are shown in the figure below:
Figure 6 - AST system automatic calibration structure diagram Figure 7 - Transmitter circuit schematic
2.3 Automatic acoustic emission data classification algorithm (automatic rating)
Traditional acoustic emission testing relies on professional acoustic emission technicians to deeply analyze the acoustic emission data in order to evaluate and rate the test object. This method is not only time-consuming and labor-intensive, but also has many application industries, large differences, and non-universal technical standards. As a result, acoustic emission monitoring technology can only be used in some research fields and is difficult to popularize in industrial applications. In addition, in the engineering application site of mechanical equipment status monitoring and fault diagnosis, it is often not only acoustic emission technology, but also other methods such as vibration, stress, strain and temperature. Compared with other technologies, the amount of acoustic emission data is often relatively large, especially when the threshold is set relatively low and the number of channels is relatively large. The large amount of data will cause a relatively large burden on the server.
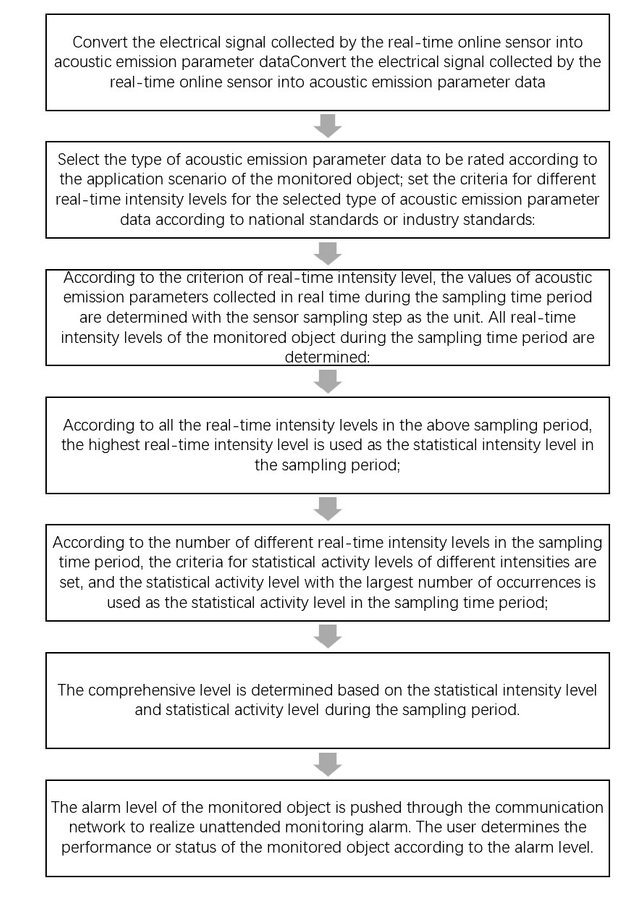
Therefore, an automatic monitoring and alarm method based on acoustic emission data classification is proposed, including: obtaining the acoustic emission data of the monitored object within the sampling time period; determining the type of acoustic emission parameter data participating in the rating according to the industry to which the application scenario of the monitored object belongs; and dividing the intervals within the selected parameter value range according to the national standard or industry standard for the type of selected acoustic emission parameter data, setting different statistical intensity levels, different statistical activity levels and comprehensive level criteria, and making corresponding alarm level responses according to the signals collected by the sensor in real time; finally, the alarm level of the monitored object is pushed through the communication network to realize unattended monitoring alarm, and the user determines the performance or status of the monitored object according to the alarm level. Automatically converting complex acoustic emission data into easy-to-understand alarm levels and lowering the technical requirements for users are of great significance to the large-scale application of acoustic emission technology in industry. In addition, through the embedded chip hardware and software implementation of the intelligent collector, noise data can be effectively reduced, data communication pressure can be reduced, and the speed of alarm judgment can be improved. The
data flow chart of its automatic monitoring and alarm method is shown in the figure below:
Figure 8 - Data flow chart of automatic acoustic emission data classification algorithm
2.4 High-precision wireless/wired synchronous clock
As we all know, the premise of time difference positioning is the high-precision clock synchronization within the channel array. Classic acoustic emission instruments often use inter-board communication to achieve clock synchronization, that is, by using an extremely high-precision on-board high-speed bus to control the synchronous acquisition of multiple channels, so as to achieve clock synchronization. Its synchronization accuracy is very high and can reach the level of hundreds of nanoseconds, but the equipment is complex, large in size, high in cost, and has limited integrated channels. Although the method of using the 485 industrial bus for wired time synchronization has the advantages of high accuracy, stable connection and high robustness, it is inadequate in the application of large-scale acoustic emission wireless device clusters arranged in an array due to the lack of flexibility and convenience. It is particularly important to choose a wireless and high-precision synchronous clock method.
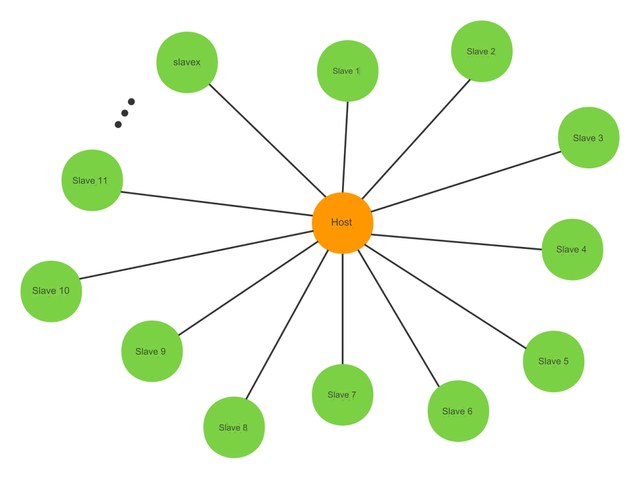
Therefore, after repeated comparisons and experiments, the two mainstream wireless time synchronization methods based on GPS and Wifi with long controllable distance, stability and reliability were determined. GPS wireless synchronization adopts multi-mode satellite navigation synchronization, which is timed by satellite and supports satellite positioning systems such as Beidou III/GPS/GLONASS. The accuracy of wireless synchronization clock is better than ±1us, which is suitable for various occasions of wireless time difference positioning, but the premise is that satellite signals can be received. WIFI wireless synchronization realizes synchronization networking function through star network technology (1 host and the rest are routing nodes), and the accuracy of wireless synchronization clock is better than ±10us. It is suitable for closed plants such as dam plants, tunnel projects, nuclear power plants, etc. where satellite signals cannot be received, and can only be synchronized by time synchronization servers. In the field of monitoring, for convenience and safety considerations, some systems have to adopt wireless communication, especially for mobile inspection and monitoring systems, which can only achieve time synchronization and second pulse synchronization by wireless means.
Figure 9 - Distributed wireless acoustic emission system based on Wifi high-precision wireless synchronous clock
3 Application schemes and practical application cases of Internet of Things acoustic wave (acoustic emission) monitoring and diagnosis equipment and online monitoring and fault diagnosis of structures and equipment
3.1 Monitoring of broken wire ropes in bridges
Suspension bridge slings, main cables, cable-stayed bridges, and arch bridge suspenders (cables) tie rods are made of several strands of steel wire. During long-term use, they are affected by excessive loads, environmental corrosion, stress corrosion, corrosion fatigue, hydrogen embrittlement, etc., and local wire breakage is prone to occur. At the moment of wire breakage, a strong elastic wave signal is generated and propagates along the wire rope. It is detected by the acoustic emission sensor placed within a certain distance and converted into an electrical signal and transmitted to the acoustic emission collector. The acoustic emission collector processes the signal, identifies the broken wire, uploads the broken wire warning to the cloud platform and then pushes it to the mobile phone, so as to achieve the purpose of real-time monitoring of broken wires.
Wire breakage is a random event that may occur at any time. Therefore, continuous and long-term monitoring of wire breakage monitoring of bridges is required. No time without data collection is allowed, and frequent power outages and crashes that require someone to recover are not allowed. RAEM1 can realize 24 hours a day, 365 days a year uninterrupted waiting for triggering collection in the wire rope broken wire system of the bridge. It adopts Linux software and hardware architecture, watchdog circuit and other designs to adapt to long-term unattended monitoring.
At the invitation of the user unit, Qingcheng Company's RAEM1 system conducted an acoustic emission monitoring test on the broken wire of a full-size bridge cable of a certain bridge, and accumulated a large amount of data. The experimental results show that the acoustic emission signal of the broken wire has high amplitude, high energy, high ringing count, high RMS, and obvious characteristics, which can be distinguished from most noise signals. The RAEM1 Internet of Things Acoustic Emission Monitoring System can accurately and effectively monitor the broken wire phenomenon. The experimental data of the broken wire has a 100% accuracy rate without missing or false alarms. RAEM1 can remotely and automatically monitor the broken wire without missing a single broken wire phenomenon, and can automatically push the broken wire and the broken wire rate to mobile phones and emails.
Figure 10 - Broken wire signal displayed in real time on the cloud platform (left) and broken wire alarm email (right)
Currently, the RAEM1 acoustic wave (acoustic emission) detection system has been installed on several bridges:
Figure 11 - Installation diagram of RAEM1 system on a bridge
3.2 Pipeline valve leakage monitoring
When gas or liquid leaks from a leak under a certain pressure, continuous mechanical waves will be stimulated at the leak. The acoustic emission waveform stimulated by the leak is observed through an oscilloscope, and its shape is a continuous fluctuation with very small amplitude fluctuations and almost no regularity. The frequency band distribution of the leakage acoustic emission wave can range from a few Hz to hundreds of kHz depending on the size of the leak, the leakage speed, and the leakage medium. Qingcheng's RAEM1 system uses suitable acoustic emission sensors to receive these acoustic emission waves from the leak site, and then converts the mechanical waves into electrical signals and amplifies them and transmits them to the acoustic emission host. After analysis and processing, the information on the size of the leakage can be obtained, and the appropriate threshold can be set to output an alarm when the threshold is reached. The leakage amount or alarm parameters are transmitted to the Internet cloud platform through the Internet of Things communication, and then pushed to the terminal user administrator to achieve the purpose of unattended quantitative leakage monitoring intelligent alarm.
Under the same medium and material size, there is a certain functional quantitative relationship between different leakage amounts and acoustic emission parameters (RMS, ASL, energy, etc.) under the same pressure difference conditions; there is a quantitative relationship between different pressure differences and acoustic emission parameters and leakage amounts under the same valve opening conditions; and there is a characteristic relationship between different leakage openings and acoustic emission parameters under the same pressure difference conditions (tank wall plug).
Figure 12 - Smart acoustic emission sensor layout Figure 13 - Qingcheng IoT platform monitoring leakage and leakage rate
3.3 Pressure vessel structural crack monitoring
When pressure vessel equipment is in long-term operation, the defects inherent in it or generated during operation expand as the loading progresses, resulting in energy release in the local structure, part of which is emitted in the form of elastic waves. The RAEM system can regularly collect acoustic emission signals during equipment operation, and through trend experience diagrams and feature analysis calculated from data, it can invert the active changes of equipment defects, inform equipment management personnel in the form of alarm results, and pay attention to and process the location of the abnormal signal. The regional positioning method is used to determine the dynamic changes of hazardous defects such as active defect expansion and medium leakage that may exist in the operating state of the container, and conduct all-weather monitoring of the dynamic changes in the operating state process under abnormal acoustic emission data.
Figure 14 - Schematic diagram of RAEM1 system monitoring pressure vessel cracks
Figure 15 - RAEM1 system monitoring pressure vessel case diagram and site map
3.4 Online tank bottom corrosion monitoring
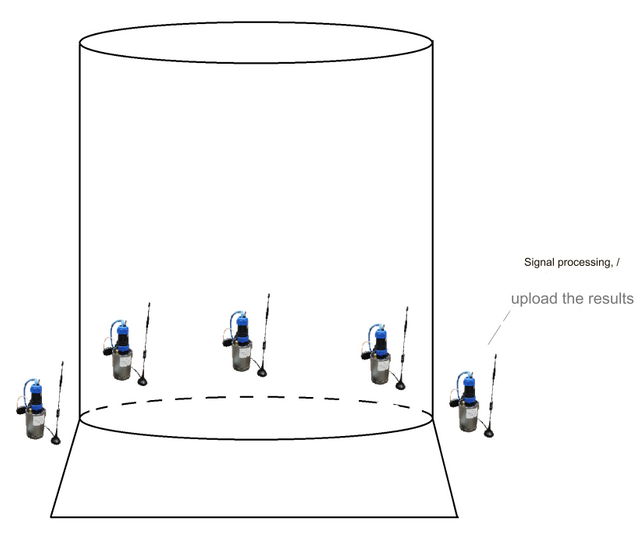
Online (non-stop operation) tank bottom corrosion monitoring uses the RAEM system, which has a built-in independent storage acoustic emission real-time collector and does not rely on a user-operated computer. The collector automatically collects, stores, and analyzes the data, and pushes the evaluation results (the evaluation results are in accordance with the National Standard of the People's Republic of China GB/T18182-2012 Acoustic Emission Detection and Result Evaluation Method for Metal Pressure Vessels) to the user's mobile phone or PC through the communication module of the third-party cloud platform, so as to achieve timely warning and timely processing to complete the monitoring of the corrosion status of the tank bottom.
Figure 16 - Schematic diagram of RAEM1 used for tank bottom corrosion monitoring
Automatic comprehensive assessment of corrosion classification: automatic signal processing and analysis of data can be performed according to the testing requirements of standard JB/T10764-2007 "Non-destructive testing of atmospheric pressure metal storage tanks - Acoustic emission testing and evaluation methods".
Figure 17 - Activity time diagram for RAEM1 tank bottom corrosion monitoring
3.5 Damage status monitoring of rotating mechanical equipment
RAEM online monitoring can be used to monitor the wear, damage, and lubrication status of various rotating mechanical equipment such as wind power bearings and amusement facilities. The RAEM system was first used on a wind turbine of a wind power company to monitor the operating status of the bearings in the chassis. The sensor is installed on the inner shaft wall of the bearing to continuously collect the acoustic emission signals generated by the wind turbine in operation. The collector will upload the collected signal data to the server or cloud server via the 4G network. Then use Qingcheng's analysis software to display and analyze the operating status of the bearing, and even calculate the cycle speed of the wind turbine.
Figure 18 - Schematic diagram of RAEM installed in wind turbine bearing monitoring
Figure 19 - Photo of RAEM installed at the wind turbine bearing monitoring site
Figure 20 - RAEM data view and cycle calculation in the analysis software
3.6 Tool wear and other machining process monitoring
The highly sensitive sensor receives the sound (acoustic emission signal) generated by the friction and collision between the tool and the workpiece during machining processes such as cutting, milling, grinding, and punching, and analyzes the acoustic emission signal to obtain the corresponding tool status (degree of wear, whether the tool grinding wheel contacts the workpiece, punch damage, etc.). Usually, the acoustic emission signal of the tool status during normal machining is small, while the acoustic emission signal of the abnormal machining process where the tool is worn or damaged is large. The ringing count and rise count of a good tool are usually much larger than those of a bad tool, and the frequency characteristics will also be different. The RAEM1 acoustic emission acquisition system receives and processes wide-band 2KHz-1MHz signals. The high sensitivity and powerful noise-removing signal processing capabilities make the acoustic emission tool status detection sensitivity much higher than methods such as human ears and vibration. The results of long-term continuous monitoring and automatic alarm output can be achieved online, remote unmanned by the Internet of Things, and other methods to meet the intelligent machining needs of the application. Replace the tool in time according to the tool status to extend the tool life, reduce tool costs, avoid quality accidents, and reduce the rate of unqualified products.
Figure 21 - Tool wear monitoring case diagram
4 Conclusion and Outlook
RAEM Internet of Things acoustic wave (acoustic emission) online monitoring system has been applied in some fields, such as bridge suspension cable wire breakage monitoring, valve pipeline leakage monitoring, pressure vessel crack monitoring, container tank bottom corrosion monitoring, and rotating machinery status monitoring. Compared with traditional acoustic emission instruments, the Internet of Things acoustic emission equipment system has the advantages of free and flexible installation, wireless data transmission, real-time cloud data display, wireless synchronization clock to locate the sound source, no need for professional personnel to analyze the results, and automatic result rating and reporting. The cloud server can access a large number of monitoring points and long-term monitoring to form acoustic emission monitoring and detection big data. The application of big data and artificial intelligence AI technology big data models can greatly improve the accuracy and ability of acoustic emission monitoring and detection. It can also form a dedicated ChatGPT for acoustic emission detection, which greatly facilitates the application.
References
[1] Ministry of Transport of the People’s Republic of China. “JT/T 1037-2022 Technical Specification for Highway Bridge Structure Inspection”. 2022
[2] Xie, J., Wang, S., Liu, W., Yang, H., Zhang, L., Liu, S. (2021). “Internet of Things Acoustic Emission: Systems and Applications”. In: Shen, G., Zhang, J., Wu, Z. (eds) Advances in Acoustic Emission Technology. Springer Proceedings in Physics, vol 259. Springer, Singapore.
Escritura robada.
Downvoting a post can decrease pending rewards and make it less visible. Common reasons:
Submit
hey
Downvoting a post can decrease pending rewards and make it less visible. Common reasons:
Submit