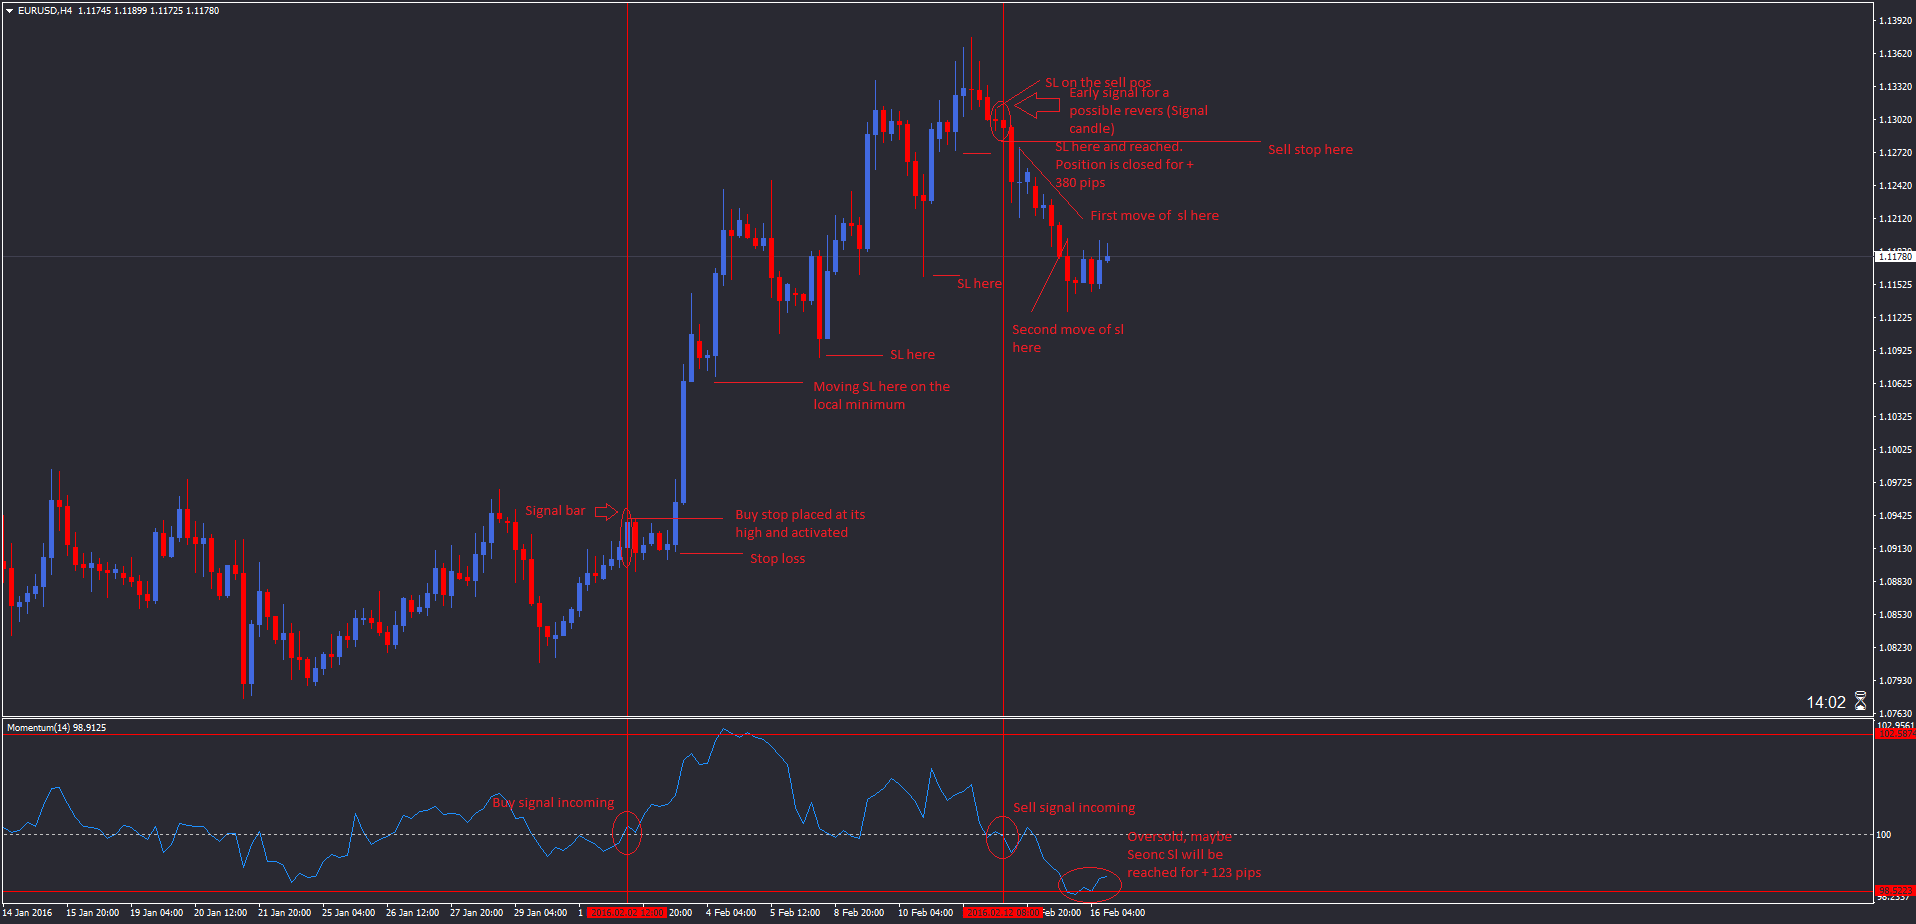
The Momentum indicator measures the speed of change of the price and it is a leading indicator for any changes in the trend. When its value is greater than 100, this means tat the current price quote is higher from that from previous periods and the market is in a up trend. When its value is under 100, this means that the current price quote is lower than the previous one from past periods and the market is in a down trend. Not only Momentum identifies a trend when reaching minimum and maximum values, Momentum also warns of overbought or oversold conditions. As a leading indicator, Momentum usually turns its direction before the price. In cases like this divergence occurs, which is one of the most assured warnings for a change in the movement.
Momentum generates the following signals:
Crossover the 100 line from bottom to top for a buy signal, and from top to bottom for a sell signal.
Trend lines - You can chart trend lines on the indicator and when they are breached (this is led by the indicator before the price) you can expect the same on the price chart.
Extreme values - as in the other oscillator indicators, the maximum values are a sign for an overbought market and the minimum for an oversold market. In Momentum in difference with RSI for example there isn't a bottom or top border for the minimum and maximum values, so thats why everyone has to determine which levels thinks are the minimum and maximum when studying the charts for a longer period of time.
Long position conditions:
The indicator crosses the 100 line after it has reached its low point and reversed its movement.
The Candle/Bar which led to the crossing of the 100 level is marked as the signal candle and we place a buy stop order above its highest point.
When opening a long position we place our stop loss at 5-10 pips below the lowest point of the signal candle or the candle we use as opening our position. This is an individual choice.
When the market goes in our favor, we place our stop loss at 5-10 pips bellow the lowest values of the formed local minimum extremes.
Example is shown in the chart above.
Test the strategy on demo at first before going real.