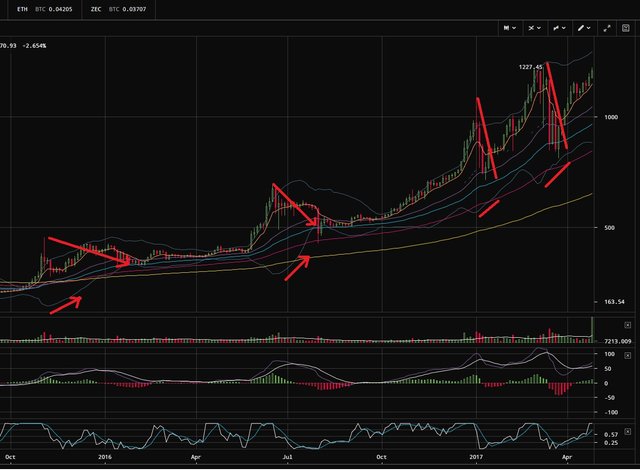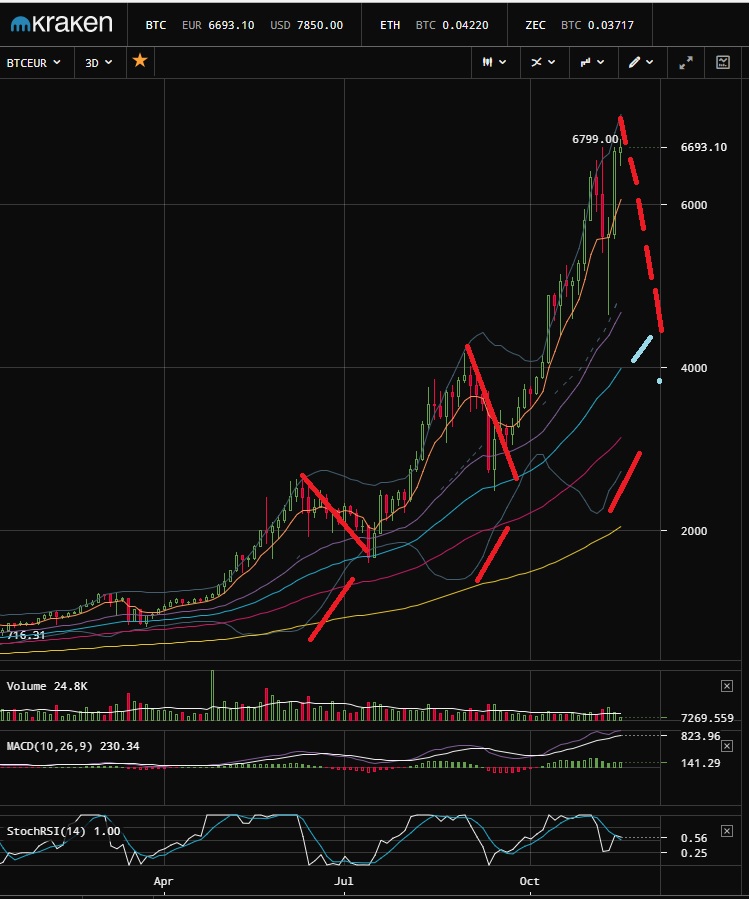
Nothing can stop Bitcoin from climbing to new heights, but is this true. The only thing maybe that can slow Bitcoin down some what is Bitcoin chart itself which should not be taken as a threat but looked upon as something natural which until now always seemed to correlate with. Take a look.

This chart shows Bitcoin from Oct. 2015 until just after Apr. 2017 and please pay attention to the Bollinger Bands especially the Bottom Band. Each time it turns upward Bitcoin consolidate down towards it. This pattern is shown 4 times here.

The chart above is the continuation of the prior graph up until the present. Then pattern continues one time accordingly, the second time down to the 50 day EMA The third time just to the 30 day EMA or is it incomplete and should come down to 4500 in Euro denominated terms or are we going straight up to 8000 euros to fall back to the 7 day EMA to make a last push to 9875 euros to come tumbling down because of the introduction of futures and option trading as of mid December.
What do you think. Will the derivative hinder or push Bitcoin higher through shorting or short squeeze higher into the stratosphere.
I think on the 1 and 2 hour candle charts one can see exhaustion for Bitcoin. It has problems going higher. If I'm right Bitcoin should go south and Bitcoin Cash north in leaps and bounds.
Downvoting a post can decrease pending rewards and make it less visible. Common reasons:
Submit