Sep. 2022, Dan LeBaron
Data Source: Footprint Analytics - NFT Volume in 2021 Vs. 2022
While NFTs have been around for a few years, the technology exploded in popularity in 2021 driven by the launch of major projects like Bored Ape Yacht Club (BAYC).
 Seemingly out of nowhere celebrities, athletes and major art collectors were drawn to the space and many began to swap out their generic profile pictures for ones featuring animal JPEGs or pixelated punk characters. Outside of PFP (profile picture) projects, NFTs popularized genres like generative art and organizations like Art Blocks also rose to fame at breakneck speed. At the same time, leading NFT marketplaces like OpenSea became household names while welcoming in a virtually endless stream of new users.
During the peaks of 2021, participants in the NFT space were euphoric as projects across the space skyrocketed in value and people around the world took part in the mad dash to find the next hidden gem that was sure to emerge. The entire phenomenon was reminiscent of the gold rush and, predictably, it couldn’t last.
Today, NFT transaction volume has dried up significantly. This, despite the fact that the vast majority of cryptocurrencies have seen significant dips in value which means that the same NFTs that collectors were rushing to buy in 2021 are now that much more affordable. So, how far has the sector fallen? Are we ‘still early,’ or were the peaks of 2021 something that will never be repeated? While the answer to the latter question is still to be written, we can explore the former one by isolating the performance of the space at large, as well as its leading projects and marketplaces this month as compared to one year ago.
Total NFT Transactions in September 2021 vs. September 2022
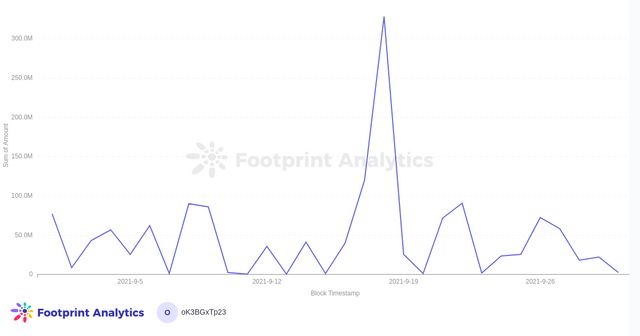 NFT Transactions, September 2021- FINAL
Looking at the number of total cross-chain and cross-marketplace NFT transactions in September 2021, we can see that the month’s peak was achieved on September 18, 2021 with the sum of all NFT transactions adding up to over $327 million. The least transactions in the month took place on September 27, 2021 with 14,599 taking place, though this was the only day in the entire month that less than 23,000 transactions took place. All in all, there were 16 days in the month in which over 100,000 transactions took place. Now, for comparison let’s see how these numbers stack up to September 2022.
 Volume across the NFT space dipped in a major way in September 2022 as compared to the same month last year. The busiest day of the former saw just over 42,000 transactions taking place, less than 1/10 of the peak of the year prior. In total, there were only two days in all of September 2022 in which more than 40,000 transactions took place.
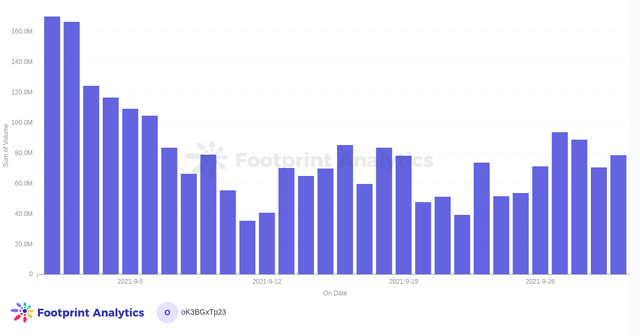
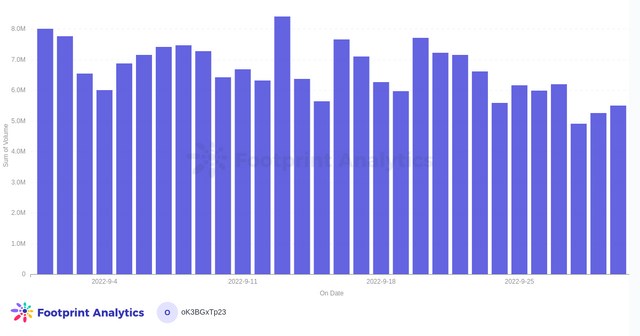
OpenSea Volume in September 2021 vs. 2022
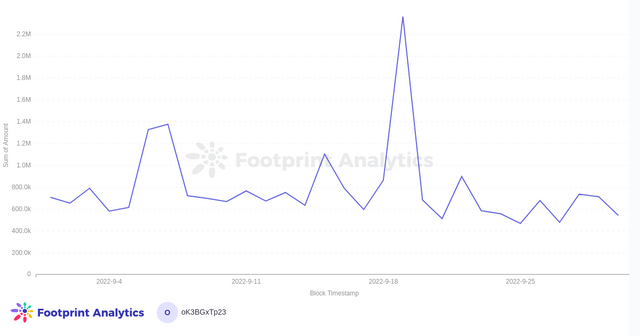
Another span indicator of the current bear market sentiment around the NFT space is the dropoff in volume on the world’s most popular NFT marketplace, OpenSea. In the charts above, there’s a stark contrast in volume in September 2021 as compared to September 2022. The most transactions on the marketplace in September 2021 took place on September 2, 2021 with over $68 million in volume occurring. There was not a single day in September 2021 in which the marketplace saw less than $4 million in volume. Fast forward to September 2022, things have changed. There has only been one day this September in which the marketplace has surpassed $1 million in volume and there hasn’t been a single day outside of that in which more than $500,000 in volume has taken place.
These charts show an exponential decline in volume on OpenSea from last year to today. This is, at best, a clear indicator that we’re in the midst of an aggressive bear market and, at worst, an indicator that the highs experienced in the space last year were in fact the peak of an NFT bubble.
Performance of Top Projects in September 2021 vs. 2022
According to OpenSea’s collection stats, CryptoPunks, BAYC and Art Blocks Curated have experienced the first, second and fifth most all-time volume on the marketplace respectively. Knowing that these are some of the most popular projects in the entire industry, examining the current sentiment in these projects versus that of a year ago is yet another indicator of the industry’s overall status.
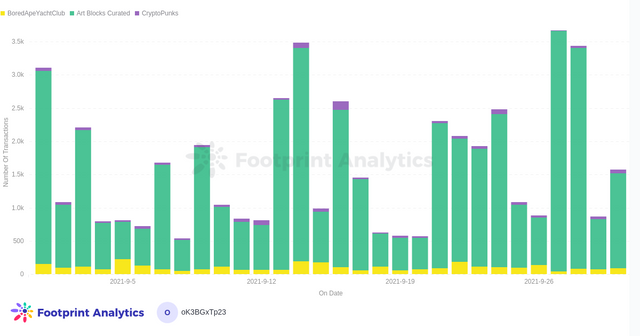 BAYC, CryptoPunk, ArtBlocks Curated Transaction Volume, Sep 2021
In September 2021, there were three days in which over 3,000 Art Blocks Curated transactions took place. Alternatively, there were only four days in the entire month in which less than 500 Art Blocks Curated transactions took place. Looking at the figures related to Art Blocks Curated makes a lot of sense as there is a wide range of options available for people with different budgets whereas even the most cost effective BAYC or CryptoPunks NFTs were only in range for high net worth individuals as of September 2021. However, it’s still a useful exercise to take a look.
On September 16, 2021, the most CryptoPunks sales took place with 131 such transactions occurring. In addition, there were seven days in the month in which more than 50 CryptoPunks transactions took place.
And finally, BAYC transactions maxed out in September 2021 at 230, which took place on the 5th of the month. Overall, there were 13 days in the month in which 100 or more transactions took place.
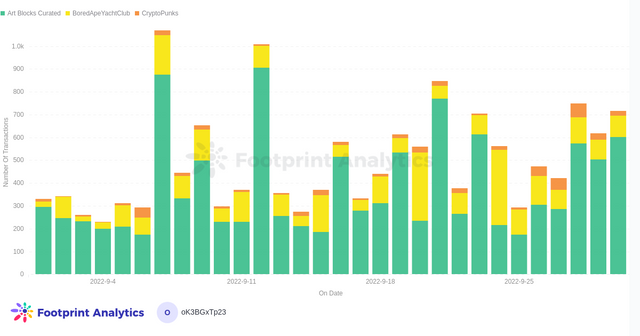 BAYC, CryptoPunk, ArtBlocks Curated Transaction Volume, Sep 2022
The chart above highlights the continued trend of waning volume in 2022 versus 2021 though BAYC is an outlier in some respects as we’ll cover below. Far less Art Blocks Curated transactions took place this month than in the year prior, with the project capping out at 906 transactions on September 12, 2022. There were also 10 days in which less than 300 transactions took place for the project in September 2022, with no such days occurring in 2022.
There were no days in September 2022 in which more than 50 CryptoPunks transactions took place as compared to seven in the year prior. The most transactions for the project took place on September 27, 2022 in which exactly 50 purchases occurred. There were also nine days in which transaction volume was only single digits, with no such days taking place last September.
BAYC, as noted, appears to be somewhat of an outlier. Total transactions in September 2022 peaked at 330 on September 24, 2022, which was 100 more than had taken place in the same month on any given day last year. There were also more days with over 100 transactions taking place in September 2022 versus last year, with nine such days taking place as compared to seven in the year prior.
Conclusion
The NFT space is still too young to decisively declare whether the bubble has popped or if macroeconomic concerns and the ongoing bear market are the largest culprits in the space’s waning numbers. However, with overall transaction volume declining significantly, as well as that of marketplaces like OpenSea and leading projects like Art Blocks, it is crystal clear that the space is nowhere close today to where it once was in terms of capital flow and overall activity. While select projects will continue to emerge that buck the current trend of relative disinterest in the space, collectors and enthusiasts should tread carefully because the gold rush has come to an end, at least for the time being.
This piece is contributed by Footprint Analytics community.
The Footprint Community is a place where data and crypto enthusiasts worldwide help each other understand and gain insights about Web3, the metaverse, DeFi, GameFi, or any other area of the fledgling world of blockchain. Here you'll find active, diverse voices supporting each other and driving the community forward.
Footprint Website: https://www.footprint.network
Discord: https://discord.gg/3HYaR6USM7
Twitter: https://twitter.com/Footprint_Data
