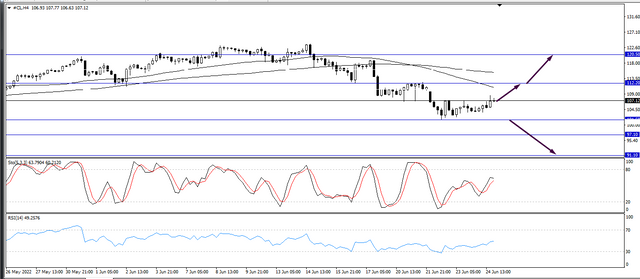
Since last week, the Crude oil price has risen. In the 4 hours chart, the asking price has declined from 101.50 central area. The stochastic indicator is trying to cross over for a bullish submerge. RSI 14 indicator is showing the price normally between 30 and 70 levels. If the price from Monday starts to bullish movements, then it can test the upper resistance at 112.20 and 120.50 levels. If the current price rebounds and breaks into the 101.50 pivot point area, then the price can start to bearish movements with the target below 97.10 and 91.10 support levels. According to my analysis, the price has declined from the central area, and it has confirmed bull’s movements after this immerse. So, it can test the upper resistance levels.

On the daily chart, the Crude oil price has declined from below 101.50 and also made a bullish candle. We examine the stochastic indicator below the 20 levels, and try to cross over for bullish movements. RSI 14 indicator has started the bullish signal. If the current situation continues to bullish movements, then it can test the upper resistance area 112.20 and 120.50. If the current price rebounds and breaks below 101.50, then it can start to bearish movements with the target below 97.10 and 91.10 support levels. Currently, the price is trading between 50, 100 straightforward moving averages. The coastal crucial trend is also bullish. So, it can test the upper resistance levels.