We have now learned how to illuminate a photo with aperture, shutter speed and iso. We now know that in some situations we have to fool our camera by manually under- or overexposing. We have already come a long way. That camera is much less complicated than you thought he was. Isn't it? ;-)
But we still have to check on our PCs at home whether we have taken beautiful pictures, whether we have properly assessed the situation, and we still have to look after the PC if the light meter of our camera has been trusted. Is there no handy tip for so you can see that on the spot, after all you can also see on your camera what the picture looks like that you made.
The answer to that is "Yes!"
We can see much more information on our camera. We can view the photo that we have made, and of course you can also see what you do when you take pictures longer, but that is usually not very reliable. A display is lit, so that quickly gives a better picture. And especially if there are photos that are too light or too dark you do not always see that well.
But do not worry, the camera manufacturers have a solution for this too. We can also look on the back of our camera at the HISTOGRAM.
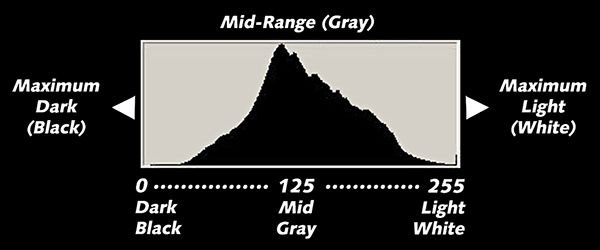
A histogram is an image on the back of your camera that shows with each picture through mountains and valleys whether your photo is well exposed. Depending on the color tones in the photo, a well-exposed histogram can look like this.

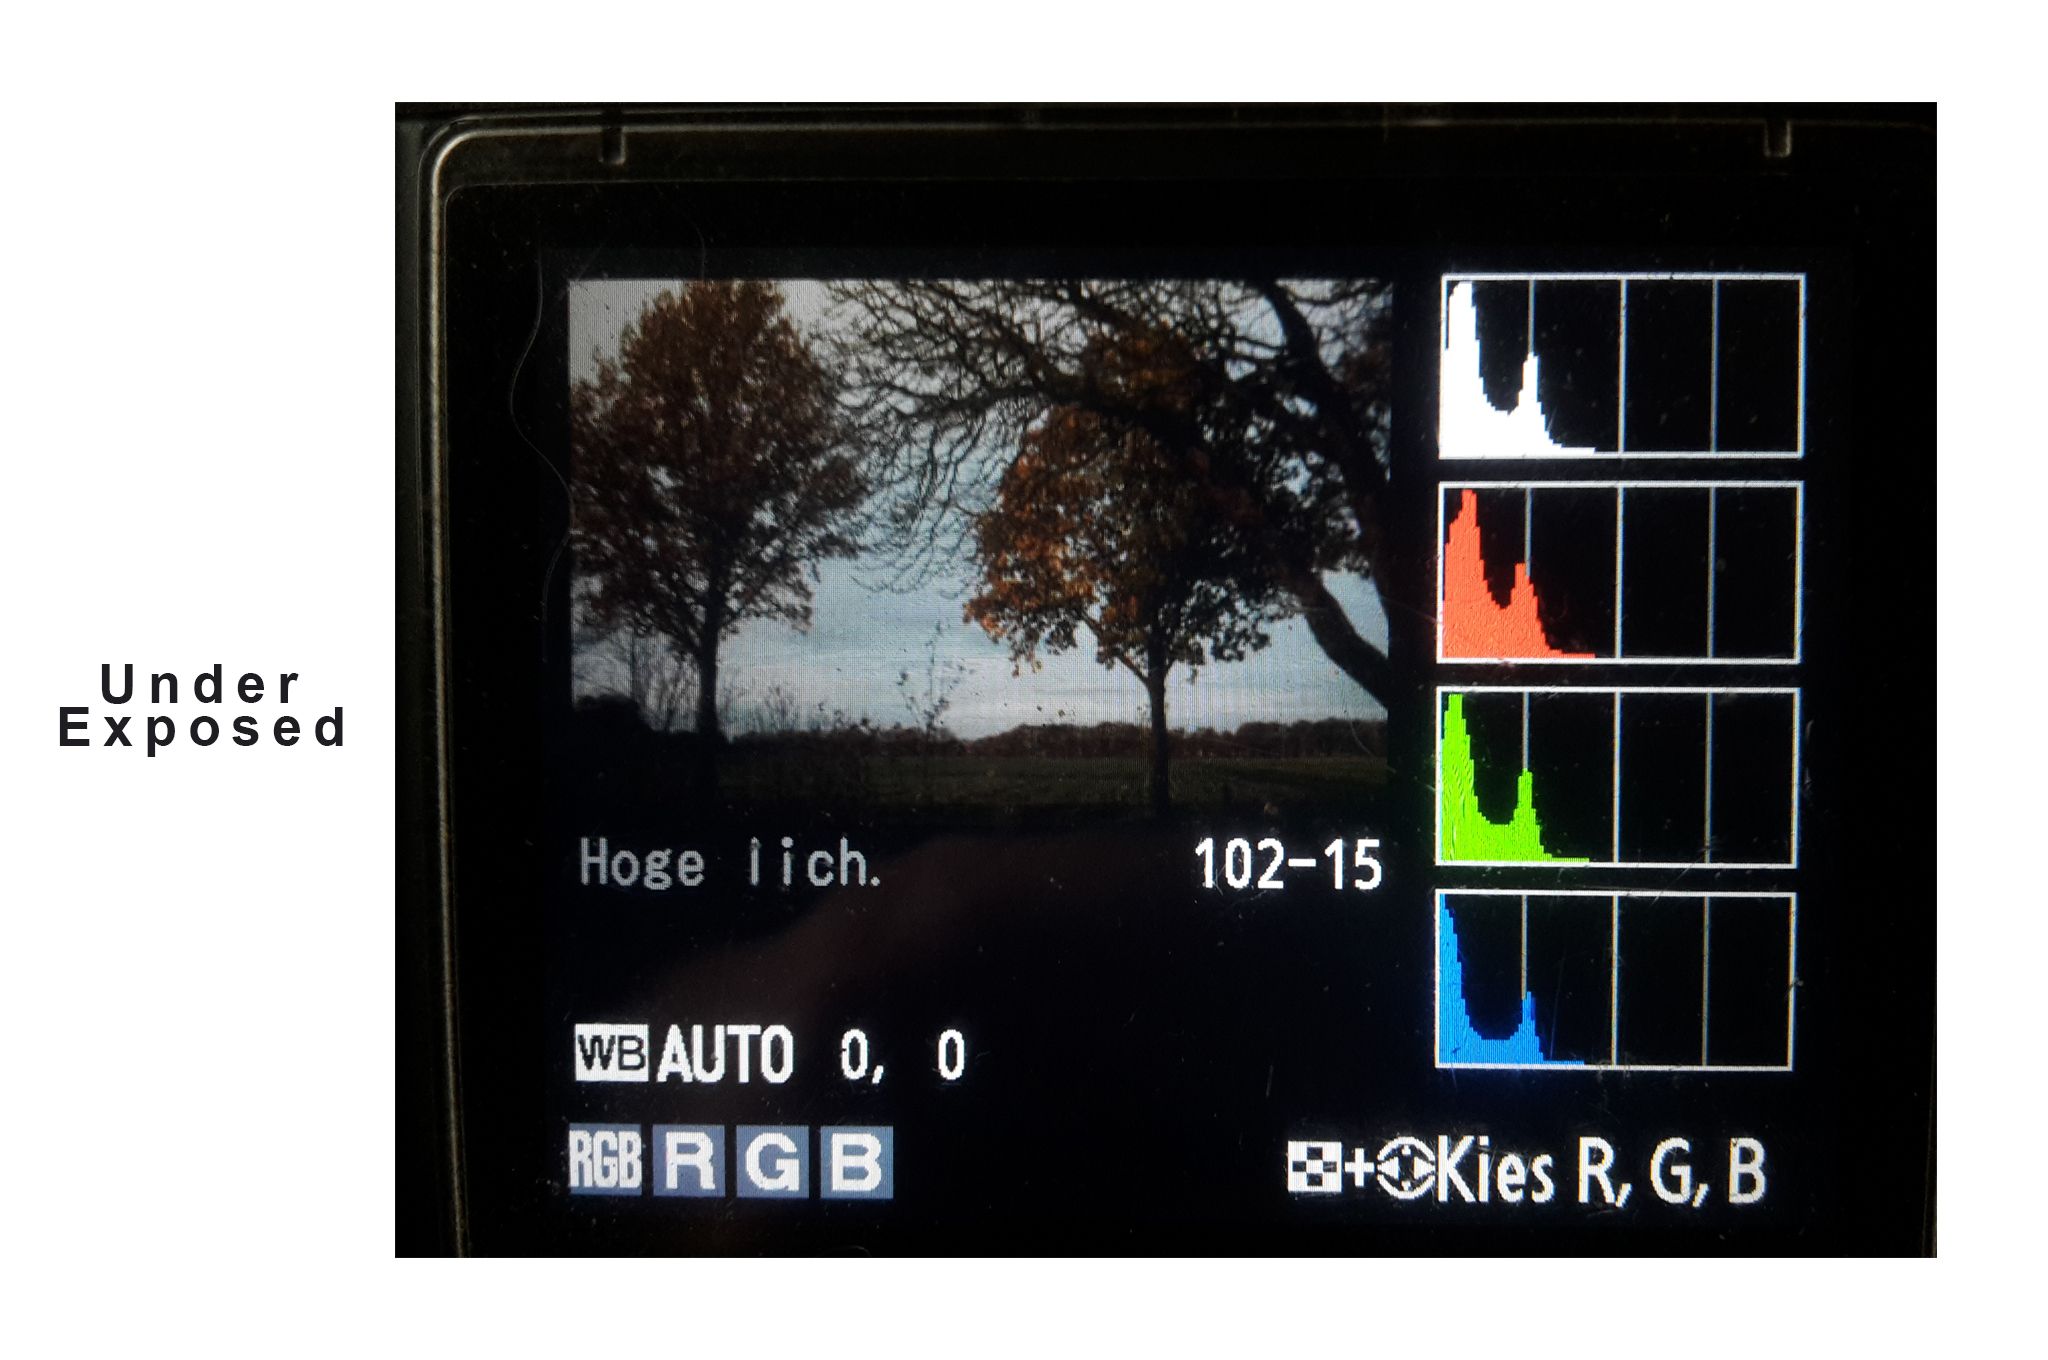
November last year I flew out in the morning and I took a few boring pictures to show you how a photo with histogram looks on your camera. I have 2 choices on my camera to show the histogram, one where I can view all color channels separately, and one where only the total histogram is displayed. I have taken photos of both to show the difference.
This picture is an underexposed photograph, and then you also see that the peaks in the histogram are mostly on the left side.
This picture is an underexposed photograph, and then you also see that the peaks in the histogram are mostly on the left side.

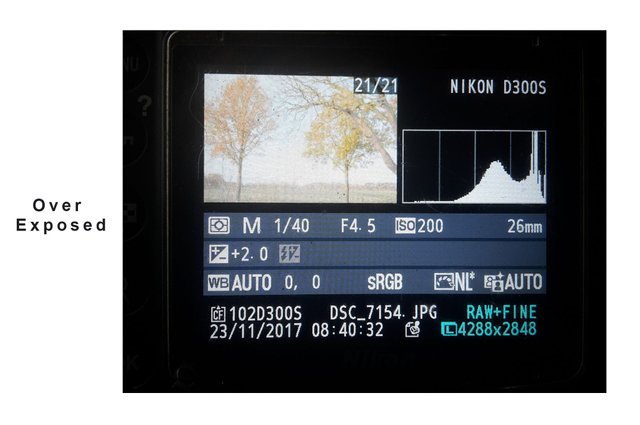
Here the picture is overexposed and you can indeed see the peaks on the right side of the histogram.

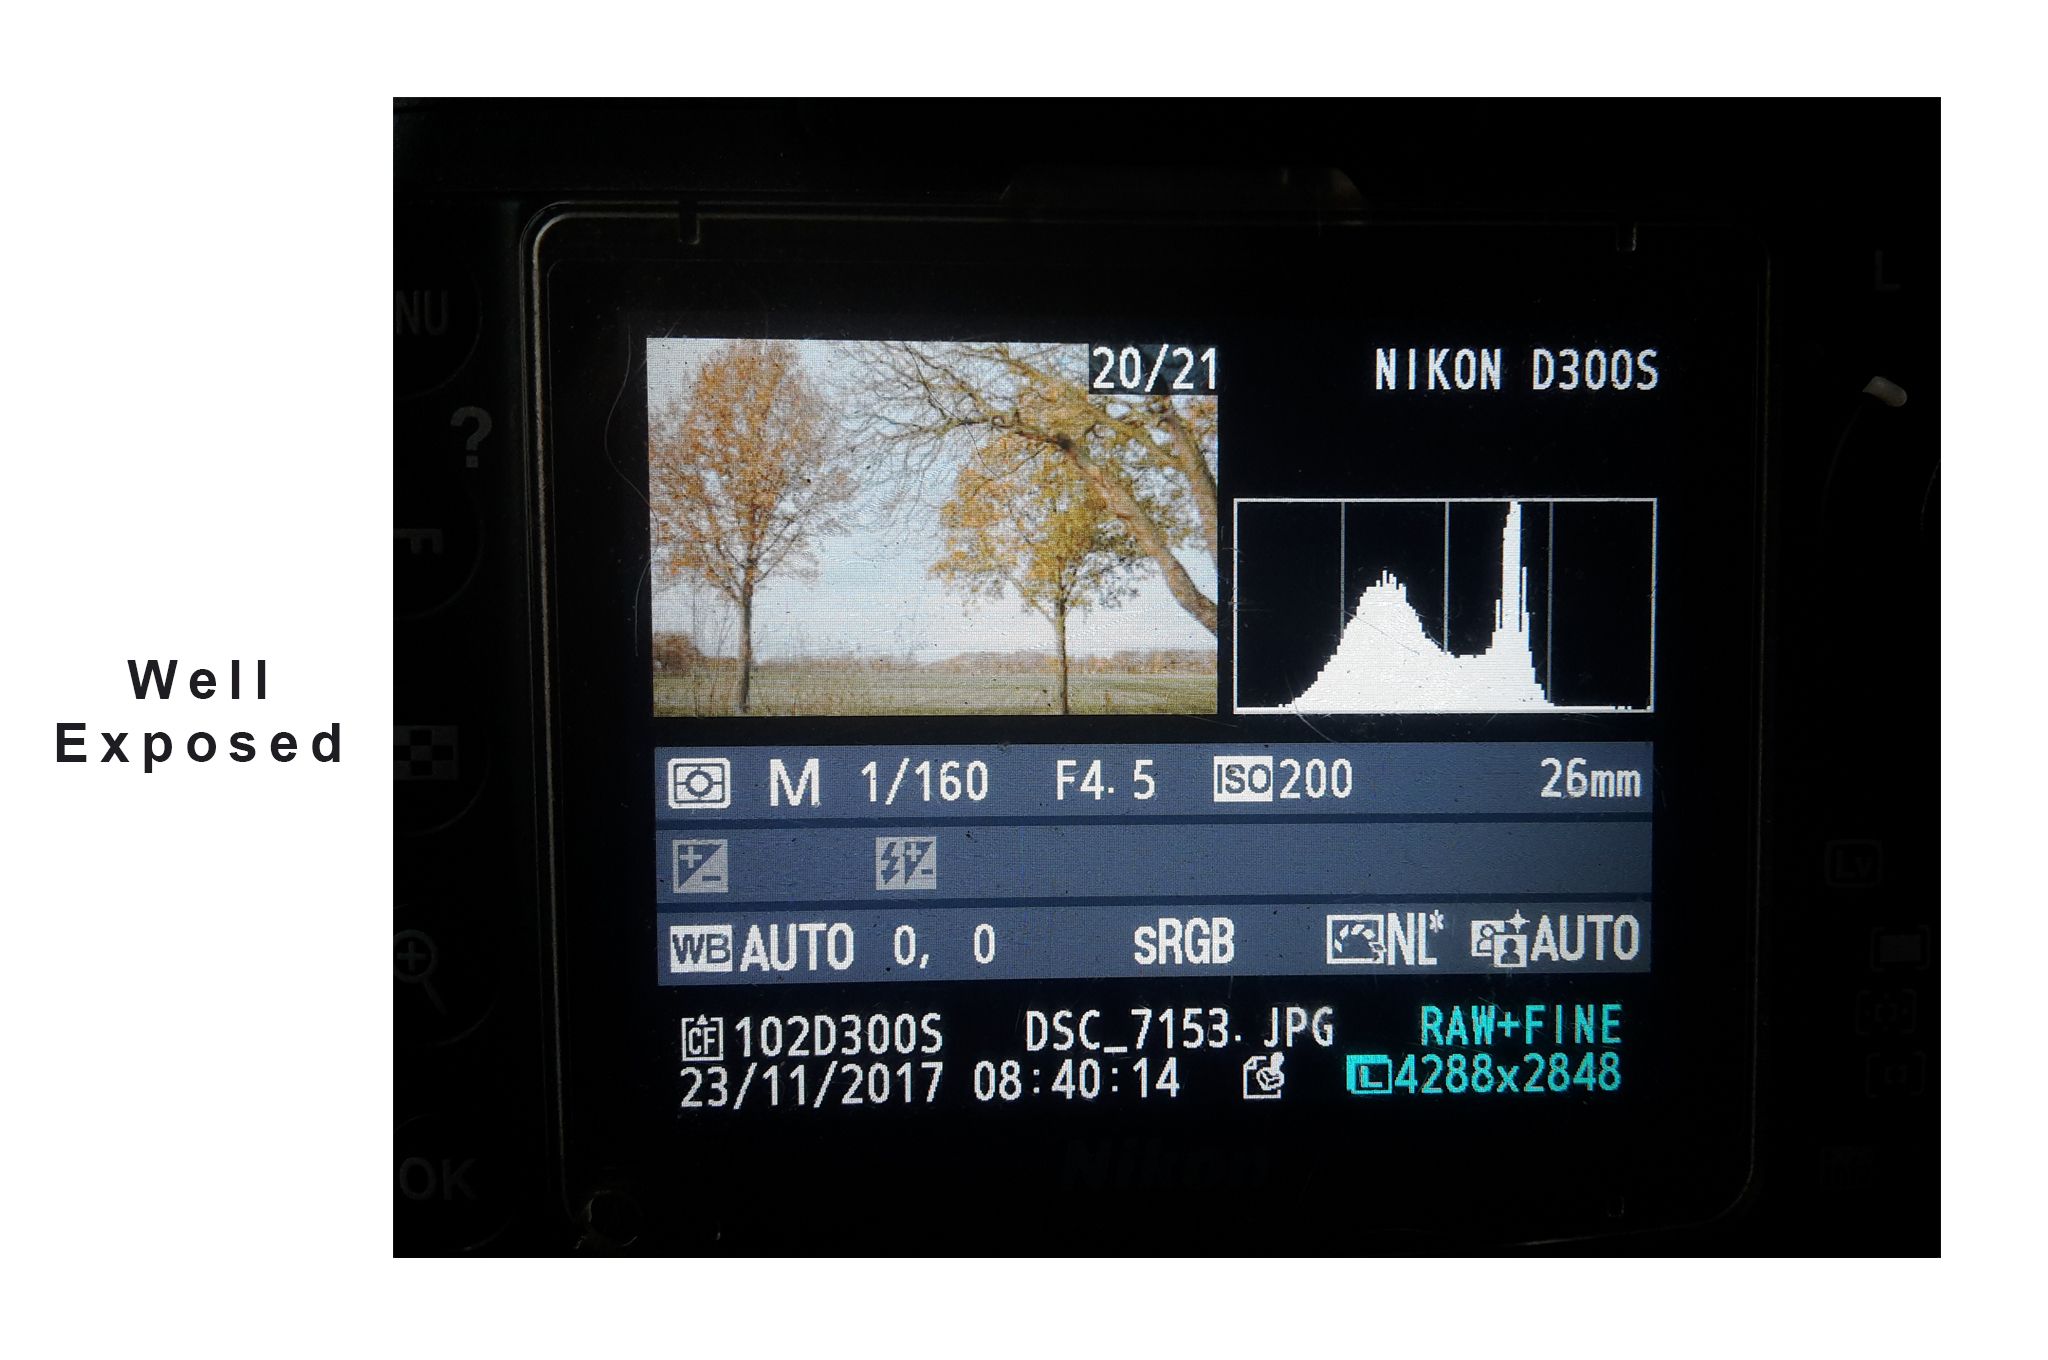
This is a histogram of good (neutral) illumination. You see here that the peaks do not touch the edges.

If I had now taken a picture with a lot of white in the picture ... then the photo is well exposed when the peaks are indeed on the right. And with a picture with lots of dark tones the mountains should of course be on the left side again.
Here a photo with the peaks on the right of the histogram.
And here's a photo with the peaks on the left side of the histogram.
But what is actually a histogram?
A histogram is an image / graph that gives you the information you want to know about the dark parts and light parts in your photos. The histogram is therefore structured differently for each photo. This is because the camera calculates a graph based on the pixels in your photo of the amount of pixels that contain dark parts and the pixels that contain light parts. The peaks and valleys in the graph therefore show the amount of pixels with the dark, middle and light areas in the photo. A histogram is always constructed with the dark parts (blacks and shadows) on the LEFT side and goes through the gray / neutral MIDDLE to the light parts RIGHT (whites and highlights).
Therefore there is no right or wrong histogram ... it is purely informative for the photographer to determine whether the lighting is good for that photo, and what the photographer wants to show in that photo.
In a histogram you can easily see if your photo is well neutral, dark or lightly lit. And that is also the function of the histogram, that you can quickly see if the lighting is to your liking.
What are important points to keep an eye on with the histogram?
We now know that when the peaks are mostly left, the photo is darkly illuminated. And when the peaks are mostly on the right, the photo is slightly illuminated.
In both cases this is fine. As long as the peaks in the graph do not touch the edges or even run out of them. As long as all the peaks remain neatly within the graph, nothing is wrong and no important data has been lost from your photo.
If the peaks are going to hit the edges then you have to pay attention. You then have reached the full Dynamic Range in F-stops that your camera can register. And if they start running from the edges, you have lost details. Translated into your photo, this means that if the graph on the left runs out, your photo is underexposed, and so detail has been lost in the dark parts. If he walks right out of the edge, this also means that detail has been lost in the light parts of your photo.
In digital photography, restoring lost detail in the light areas is particularly difficult, which is why many photographers will opt for so-called 'lighting on the left'. After all, in the dark parts it is all easier to repair with an editing program. Especially when photographed in RAW, an underexposed photograph often has something to do.
I will tell the difference and the advantages and disadvantages of RAW and Jpeg in a subsequent blog, but the amount of information that your camera stores in a photo is one of the most important differences and one of the biggest advantages to photographing in RAW. After all, your camera stores much more information than RAW then in Jpeg.
However, we were talking about the histogram now and why you would use it.
The reason is therefore very simple. This way you can see at a glance whether the dark parts still contain all information and whether the light parts still contain all the information. If the graph touches the edges, you can see at a glance whether you have to change something, and if so, then you also know what you have to change.
We already know what shutter speed, aperture and iso do. And also how we should overexpose or underexpose.
A histogram is divided over F stops, the so-called Dynamic Range of the camera. That is the difference in light stops that a camera can capture. So if you have an image where there are more light stops in the picture then you will have to make a choice. That can not capture a camera and you are going to lose detail anyway. But then you have the choice whether it is on the light side or on the dark side. Once you have practiced reading the histogram, you can even use your histogram to determine how many stops you need to correct with your exposure to shift your peaks in your histogram back to the neutral middle area if you want to!
But as with shutter speed, aperture and iso, there is no standard, and that the photographer is the decisive factor in every photo, so also for the histogram.
The histogram is a tool, a powerful tool for you as a photographer, and you can determine whether you are happy with how you have exposed the photo. The histogram is certainly NOT a means of determining whether your photo is right or wrong. The only one who can decide that is you as a photographer because even if your histogram indicates that information has been lost in the dark parts, maybe that is what you wanted. In that case you have done well! And so also for the light parts.
We now know that every photo has a different histogram. What you can read from the histogram now you know now, so I would say, take care when you go photographing, and see what you can do with it!
In the ideal situation, your histogram is an image that just touches the edge from the left, then runs to the right with a nice proportional mountain and also touches the edge. In practice, however, you will rarely see such an ideal histogram. There is also a lot possible in post-processing, as long as your histogram does not run outside the edges. But I will not go into that now ... that is another blog!
For now, wish you all a nice day and steem on!
Please upvote this post if you liked it, leave me a reply or resteem it.
more clear impossible! Thank you !
Downvoting a post can decrease pending rewards and make it less visible. Common reasons:
Submit