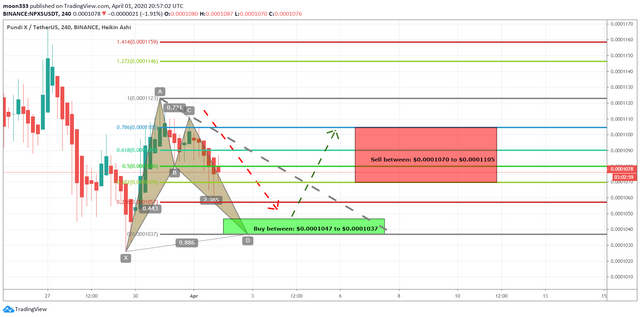
Formation of bullish BAT:
This time short term 4 hour chart the price action of Pundi X (NPXS) is forming bullish harmonic BAT pattern. And this is another awesome opportunity to earn more profit.
Let's dig this pattern deeper to see how perfectly this pattern is driven:
 Click here to visit tradingview for complete chart
The first leg was started from 29 Mar to 30 Mar 2020 and after that the next A to B leg is retraced between 0.382 to 0.50 Fibonacci levels, then B to C leg is moved up to the Fibonacci projection level between 0.382 to 0. 886 Fibonacci and that is the Fibonacci projection of A to B leg. Then C to D leg should be retraced between 0.786 to 0.886 Fibonacci levels for the completion of BAT.
Buying And Sell Targets:
The buying and sell targets according to harmonic BAT pattern should be:
Buy between: $0.0001047 to $0.0001037
Sell between: $0.0001070 to $0.0001105
Stop Loss:
The potential reversal zone area which is up to $0.0001037 can be used as stop loss in case of complete candle sticks closes below this level.
This idea is for short term traders not a long term idea, I will be keep posting more trading ideas.
Note: This idea is education purpose only and not intended to be investment advice, please seek a duly licensed professional and do you own research before any investment.
HIVE (THE NON-COMMUNIST, NON-CENSORED, JUSTIN SUN EXCLUDING SOCIAL BLOCKCHAIN) IS ALIVE, COME JOIN US!!!
https://peakd.com <--- Log in with your Steem account today!!
Downvoting a post can decrease pending rewards and make it less visible. Common reasons:
Submit