One of the great things about crypto is that almost all the exchanges have APIs of some sort. Most of these are to get traffic from bots but they're still very useful for us humans that want to analyze the data and work with it.
For this tutorial, I'm going to demonstrate a simple way of pulling prices from Poloniex. The extended API documentation can be found here.
Understanding the API Call
A sample API call looks something like this https://poloniex.com/public?command=returnChartData¤cyPair=ETH_GNT&start=1498650000&period=300. You can paste it into your browser and you can see for yourself how it looks. Link.
Now let's break down that API call a bit.
| URL Chunk | Explanation |
|---|---|
https://poloniex.com/public? | Base of the API call |
command=returnChartData | This tells the API you want chart data |
currencyPair=ETH_GNT | The trading pair you want |
start=1498650000 | Time stamp for where the data starts |
period=300 | Time interval to return the data in |
Play with the URL and try to get other trading pairs like BTC_ETH or USDT_BTC. You'll notice the data is returned in a structured called JSON or Javascript Object Notation. If you're not familiar with JSON, I've conveniently googled it for you here.
Pulling it into R
First of all, this tutorial relies on a bit of functional programming. The packages you'll need are dplyr and RJSONIO. The first is so you can pipe data from one function to another without writing it back to memory and RJSONIO is to convert the raw JSON object from the Poloniex API to an R object. Lastly, you'll need a package called tomkit which is a series of helpful functions I've written through my (short) data science career. If you have devtools, you can install it from Github directly with devtools::install_github("gimperion/tomkit")
The code to set it all up is very short --
require(tomkit)
require(RJSONIO)
require(dplyr)
## start date can be updated for smaller data chunks
grabPoloData <- function(symbol, start="1405699200", tspan=300){
cat("Grabbing ",symbol, " prices from Poloniex", fill=TRUE)
"https://poloniex.com/public?command=returnChartData¤cyPair=%s&start=%s&end=9999999999&period=%d" %>%
sprintf(symbol, as.character(start), tspan) %>%
fromJSON() %>%
lapply(function(y){
y %>%
t() %>%
as.data.frame()
}) %>%
bind_rows() %>%
mutate(date = as.character(date)) %>%
select(date, weightedAverage, high, low, quoteVolume) %>%
setNames(tolower(c("date",
symbol %+% "_price",
symbol %+% "_high",
symbol %+% "_low",
symbol %+% "_qvol")))
}
All the work is done in one function, grabPoloData. The function accepts a valid trading pair (ex: ETH_GNT) and allows you to optionally specify a start time and a time interval. You can easily modify the function to accept an end-time but that's for another tutorial.
You can invoke the function like such: foo <- grabPoloData("ETH_GNT")
The function assembles the API call, converts it to JSON, then goes line by line, converting the data to a data frame. It formats the date column to character, then returns the columns date, weightedAverage, high, low, and quoteVolume. Again, feel free to edit to play with columns available.
Very Basic Visualization
I can go on and on about working with time series data as many books have been written about it. (Please comment if you'd like another tutorial!) But this tutorial is simply about pulling down the data and doing something with it.
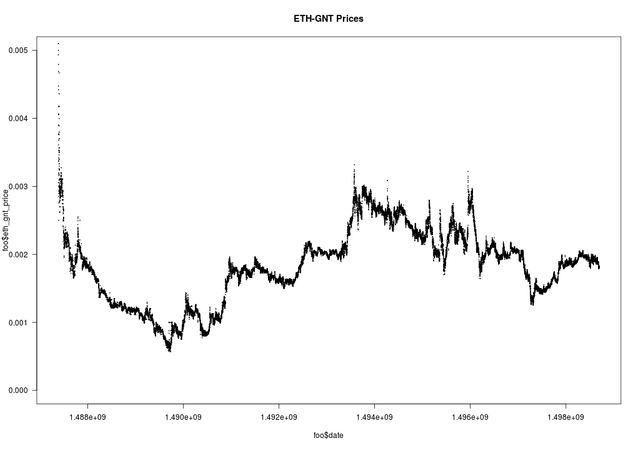
You can immediately start to plot out the price progression with a simple plot(foo$eth_gnt_price).
Obviously, this looks pretty hideous and not useful. So with a few simple options in R-base, you can get something much better looking like this:
plot(foo$date, foo$eth_gnt_price,
    pch=19, cex=0.1, ylim=c(0,0.005),
    main="ETH-GNT Prices", las=1)
TADA!

This tutorial was adapted from some code I wrote a month ago to play with the prices. The original repository can be found on my Github page. Link
All comments welcome and appreciated.
Excellent. Keep up the good work.
Downvoting a post can decrease pending rewards and make it less visible. Common reasons:
Submit
Congratulations! This post has been upvoted from the communal account, @minnowsupport, by gimperion from the Minnow Support Project. It's a witness project run by aggroed, ausbitbank, teamsteem, theprophet0, and someguy123. The goal is to help Steemit grow by supporting Minnows and creating a social network. Please find us in the Peace, Abundance, and Liberty Network (PALnet) Discord Channel. It's a completely public and open space to all members of the Steemit community who voluntarily choose to be there.
If you like what we're doing please upvote this comment so we can continue to build the community account that's supporting all members.
Downvoting a post can decrease pending rewards and make it less visible. Common reasons:
Submit
This is awesome! I have looked into some R training for finance, but this is the first I've seen for crypto!
Downvoting a post can decrease pending rewards and make it less visible. Common reasons:
Submit
Thanks! I'll be updating this as a part of a series with time-series analysis and deep learning. Stay tuned. ;)
Downvoting a post can decrease pending rewards and make it less visible. Common reasons:
Submit