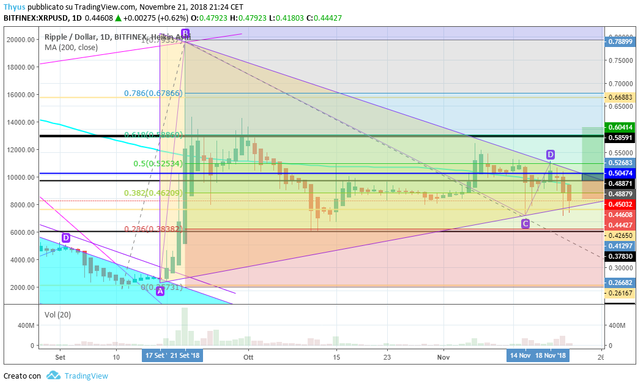
Hello everyone, in this article I will try to conclude the analysis started yesterday in the video on the XRPUSD exchange, where we move the points 'C' and 'D' of the triangle pattern to re-evaluate the price movements, thus modifying the investment strategy .
As you can clearly see in the picture the points in question have been moved by the following values:
C = from red candle 11 October 2018 with red candle 14 November 2018;
D = from green candle October 15, 2018 to green candle November 18, 2018.
These shifts have shown a trend in the model and therefore also the change in the trend that bears down from side to side, with a start of compression of the price at $ 0.4620 which is on the 0.382 Fibonacci level, which has been used in the past as a pin, where the price of lateralization has led the support to become resistance.
Analyzing from 20 September 2018, data in which the value of Xrp has attempted the first rise, and then confirm it in the following days, we note that the level in question has held up as support on September 22, 2018, drawing a green candle (this is just under $ 0.46 and hit the highs at $ 0.6270, then closing the day at $ 0.5646); on September 25th the day was in red but the price exceeded the level, reaching $ 0.4355, purchase orders began to be executed thus creating a long spike that brought the price to close at $ 0.5003.
From October 6th to October 10th the level came support, in those days they were all red and every time I touched the level of 0.382, only small spikes were shown that showed a slow exhaustion of purchase orders.
On October 11 Xrp fell below the found support, reaching $ 0.3776, thus meeting another support, for a few days Xrp remained below the pivot, suggesting that the price is backing, however the October 15 on the chart was formed a long green candle that led the coin to exceed the level of Fibonacci, but the run stopped at 0.52 $, where is the next level of Fibonacci (0.5), in that case the value of Xrp He withdrew from the race behind him a very long spike and thus creating a very clear reverse hammer, closing the day at $ 0.44.
The days that followed were raised and kept the price above the Fibonacci level, using it as a stable support, on October 28th however there was an attempt to reverse the trend, which lasted 3 days without ever falling below the support band (0.50 $ -0.42 $), where the value 0.46 $ serves as a pivot.
From November 1, the price has begun to climb to peak at $ 0.57 on November 6, from that day the price attempted some descent without ever being able to overcome the pin of Fibonacci, if not at some time on Wednesday 14 and Thursday 15, where two spikes have come down that highlighted the strength of contrast between the orders in BUY / SELL.
On Tuesday 20 November the price manages to break through the pivot 0.382 and touches 0.41 $ also coming out from the base of the pattern, arrived at that price is immediately pushed up closing on the pin at 0.4617 $, this candle stimulates sales of the day after they pass the pivot quietly and close the day at 0.4461 $, reaching lows of 0.4183 $.
This information presents us with a lateral trend that moves within a triangle pattern, which in the future will not allow the prolongation of this situation, in fact if the trend will not start to move towards a specific direction the decline in interest towards this couple it could increase, still lowering the volumes of exchange that have swollen only in the last few days.
I conclude by recalling that last year ended in the same way - even if with different data - this will become interesting if we had to review a sudden rise of the entire market from mid-December.
This article has been translated with Google translate
For those wishing to deepen this is the link of the video analysis of the morning (this video is in italian lenguage)