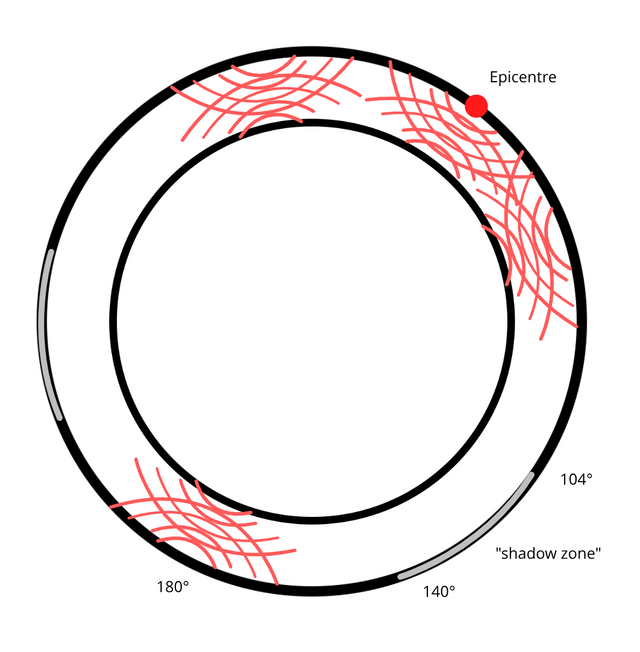
Made an illustration to show why seismic readings from earthquakes go silent at 104° to 140° (from epicentre), and then appear again: energy loss with distance, then convergence at 180° (from all directions, on a globe, a crust surrounding a hollow space. ) Fits the data very well, as you can see, a very very simple model to explain the data.

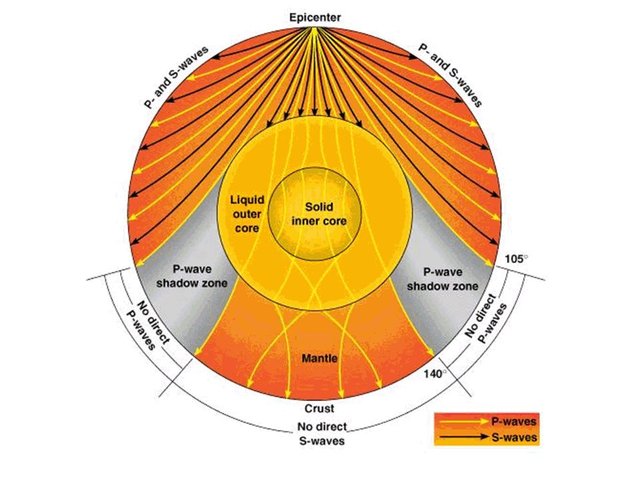
The model most people believe in, explained the "shadow zone" with refraction.
