#Silver - Remains Long Term Bullish

#Silver - Technical Analysis
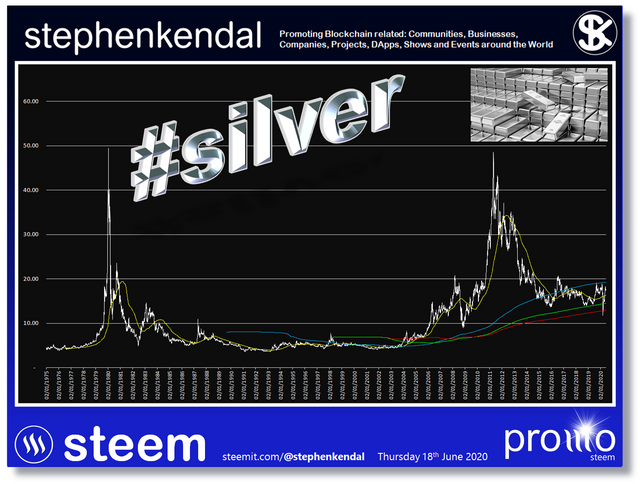
With data going back to 1975 I am pleased to see that the recent Long Term Bullish reversal for #Silver triggered back in 2015 remains very much intact.
After triggering a Bullish Buy Alert in December 2015 it is great to see that #Silver remains in a Long Term trend to the upside.
For those that follow #Silver I have included the following moving averages in the chart below...
365 dMA (yellow line) - Approx. ~1 year Moving Average
3650 dMA (blue line) - Approx. ~10 year Moving Average
5800 dMA (green line) - Approx. ~16 year Moving Average
7000 dMA (red line) - Approx. ~19 year Moving Average
#Silver - 45 Year Chart

#Silver - Chart Close-up (16 years)

#Silver - dMAs
365 dMA (yellow line) - Approx. ~1 year Moving Average
3650 dMA (blue line) - Approx. ~10 year Moving Average
5800 dMA (green line) - Approx. ~16 year Moving Average
7000 dMA (red line) - Approx. ~19 year Moving Average
You will see from the chart above that all the Long Term dMAs are trending to the upside.!!
This is great news for all the #Silver Bugs out there as #Silver continues to consolidate between $14.00 and $21.00
Thanks again for reading.
Stephen