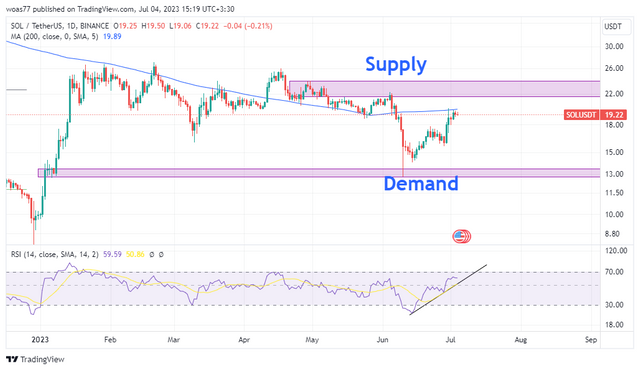
The blue line is the 200-day Moving average, which is currently playing a resistance role.
It is reasonable to save profit as it approaches the supply area.
Pay attention to the trend line drawn on the rsi, if it breaks you can save profit or exit the trade.
Pay attention to macroeconomic data in the coming days.
