
Data analysis with Excel
Hi everyone!
Welcome to this week's engagement challenge. Let's discuss Data analysis using Excel tools.
Excel is a great way to representing information on various chats. A specified data can be arranged and organized using Excel in a more readable and understandable way. This can be employed in areas like hospital , businesses and other domains we haven't mentioned. This is so important as we are able to see clearly the variation in information and the various statistics of a given chat for a particular period.
Explain what I understand by Excel charts and discuss three (3) types of Excel charts that I know with clear screenshots.
Excel charts are visual representations of data that can help us read, understand and analyze information more efficiently. They can be used to display trends, patterns, and relationships in your data, making it easier to spot important insights or differences in levels.
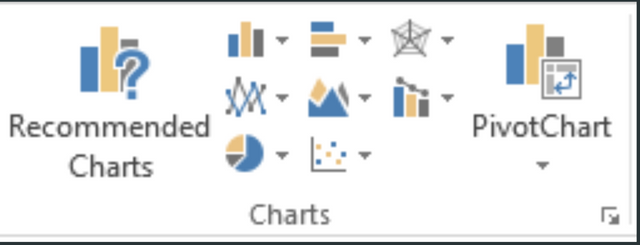
A variety of this chats can be found in Excel sheet, right? Under the insertion tab, you will find a variety of the franchise which could be used to represent data among which you could choose the one which is more suitable irrespective of the work you want to represent. Except Chats going to be used necessarily, For cases like comparing information,descriptive statistics e.t.c
Naming the various type of chance you can have;
- Pivot Chart
- Pie Chart
- Bubble Chart
- Column /Bar Chart
- Hierarchy Chart
- Bubble Chart
- Area Chart
- Pie Chart
- Statistics Chart
Below are three common types of Excel charts:
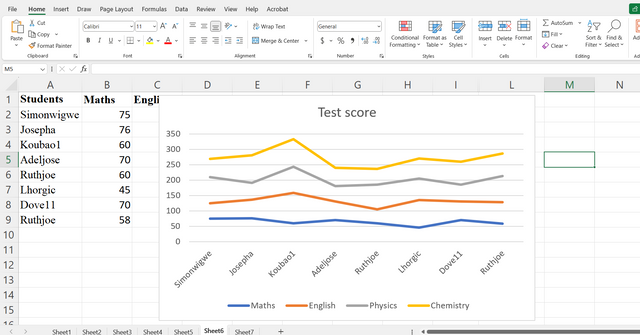
1• Line Chart:
It is be Used to show trends over time or to compare multiple data sets. Example can be comparing the grades of different students and their performance in a particular test score
- Appearance: A line chart consists of one or more lines connected by data points.
2• Bar Chart:
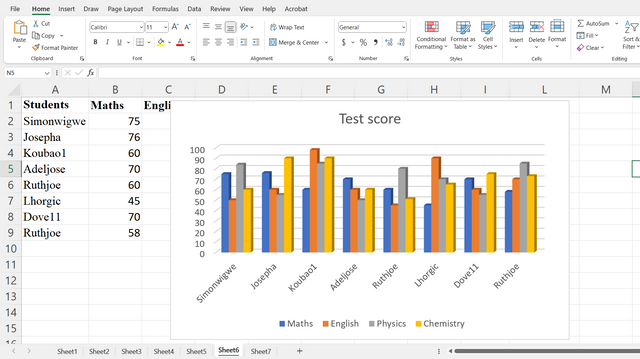
Used to compare categories or groups of data. This could be sales, customer satisfaction rate, or showing the distribution of data within a given category For instance, age group, income level.
Appearance: A bar chart consists of vertical or horizontal bars, with the length of each bar representing the value of the corresponding data point.
3• Pie Chart:
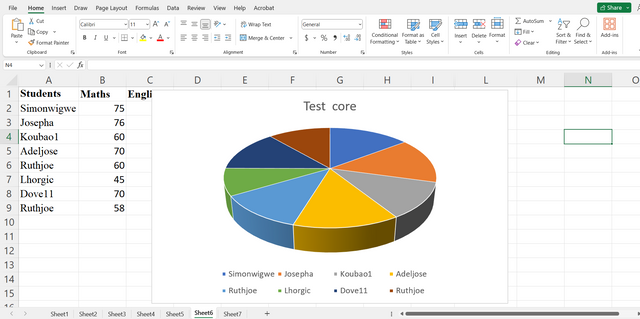
Pie charts are Used to show the proportion of each category within a whole. They represent data in easy to read and appealing way. Mainly used to compare relative proportions to different categories.
- Appearance: A pie chart consists of a circle divided into slices, with each slice representing a category.
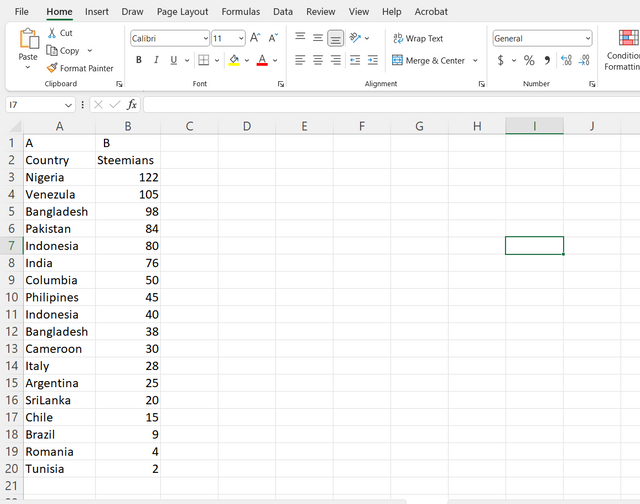
Verify that I can read the information regarding chart location and creation in Excel and interpret it correctly using Bar Charts based on the data given below.
| A | B |
|---|---|
| Country | Steemians |
| Nigeria | 122 |
| Venezuela | 105 |
| Bangladesh | 98 |
| Pakistan | 84 |
| Indonesia | 80 |
| India | 76 |
| Columbia | 50 |
| Philippines | 45 |
| Indonesia | 40 |
| Bangladesh | 38 |
| Cameroon | 30 |
| Italy | 28 |
| Argentina | 25 |
| SriLanka | 20 |
| Chile | 15 |
| Brazil | 9 |
| Romania | 4 |
| Tunisia | 2 |
To represent they are both information only by chat. There are a certain key criterias we should follow in order to get successful result.
The first thing to do is highlights the data you want to represent on the bar chart, then move to the insert menu on your Excel sheet, then navigate to the portion where you have chat and you'll be able to find bar chat. From here. You can represent the information and do the necessary editing as follows.
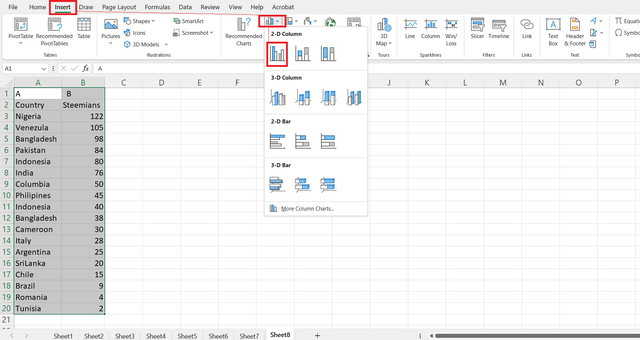
After selecting the desired bar chart, you click on it and then the information will appear as follows on the bar chart.
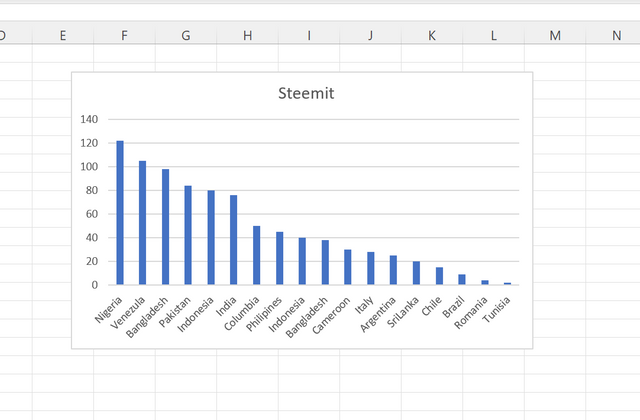
To give more detail of this chart, we can then add some titles and legends. Maybe possibly styling the chat to look more desirable and readable.
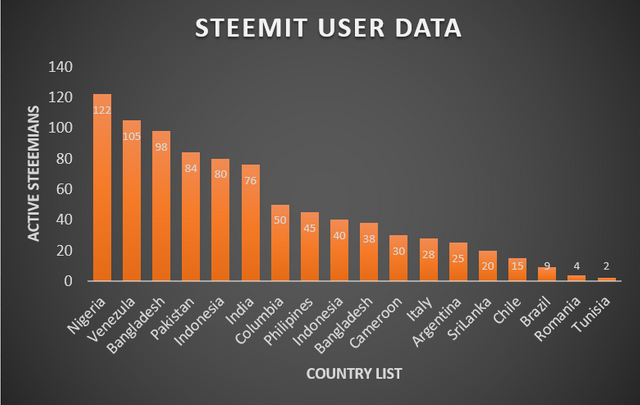
From the above chat, I was able to label the access which give more insight for the results to identify the number of steemians who are more active in a given country.
As it reads, Nigeria has the highest number of active stimulants which is a total of 122 followed by Venezuela with a total of 105, The least of this country being Tunisia with a count of 2 active steaemians.
Briefly discuss Data Analysis Techniques In Excel and tell us how we can organize data in Excel for analysis.
Data Analysis Techniques in Excel
Excel offers a robust set of tools for analyzing data. Here are some common techniques:
- Descriptive Statistics: This type of data is used to measure the central tendency of data; Calculate summary measures like:
mean, median, mode, standard deviation, and variance to understand data distribution.
We employ the formula set
=Mode()
=Average ()
=Median ()
=STDEV.S()
=VAR.S()
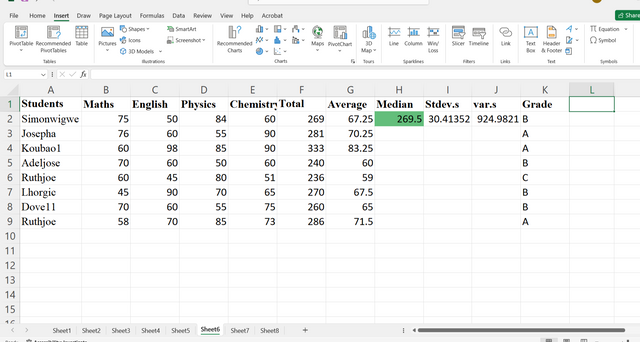
Data Visualization: Creating charts such as
line, bar, pieto visually represent data and identify trends or patterns.Correlation Analysis:* Use to Measure the relationship between two variables to determine if they are correlated.
Regression Analysis: Model relationships between variables to make predictions or understand cause-and-effect relationships.
Hypothesis Testing: Test hypotheses about population parameters using statistical tests like t-tests, ANOVA, and chi-square tests.
Data Cleaning and Preparation: Clean and prepare data for analysis by handling missing values, outliers, and inconsistencies.
Organizing Data for Analysis in Excel
Effective data organization is very important for accurate analysis . Below are things we need to know
Consistent Formatting: Use consistent formatting for cells, columns, and rows to improve readability and maintain data integrity.
Clear Headers: Use clear and descriptive headers to label columns and rows, making it easier to understand the data.
Data Validation: Set up data validation rules to ensure data entered into cells meets specific criteria (e.g., numerical values, date formats).
Pivot Tables: Use pivot tables to summarize and analyze large datasets by grouping data and calculating aggregate values.
Data Filters: Apply filters to quickly find specific data within a range based on criteria.
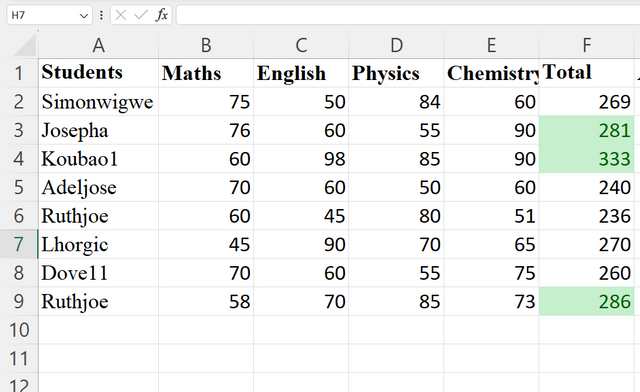
Conditional Formatting: Use conditional formatting to highlight cells based on specific criteria, making it easier to identify trends or outliers. Example >
270
Using the data given in question 2, arrange the names of countries alphabetically using data sorting techniques. Screenshots are needed.
Data sorting .
This process involve selecting and filtering our relevant information and making it more clear to the reader. For instance, in this case we are asked to filter out the data in alphabetical order. This means more relevant information will be placed at the top based on their order of importance.
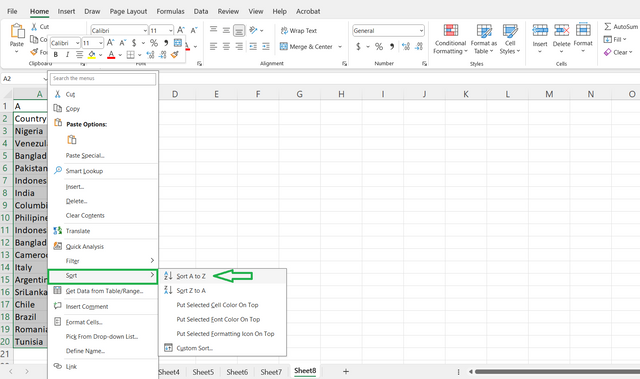
To do this We highlight our data, in the column. We want to be sorted, then right click and move down to the option where it shows sort. From here you can formatic in a way you want the data to be sort. Sort data In alphabetical order it's much easy. I still just do it in one click. sort A to Z.
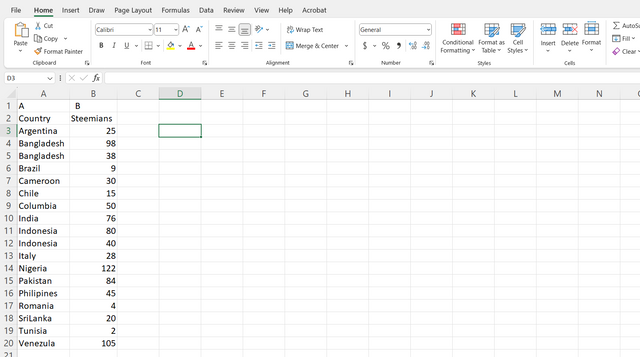
We can observe that. Our budget has also been adjusted and this is how it looks like now
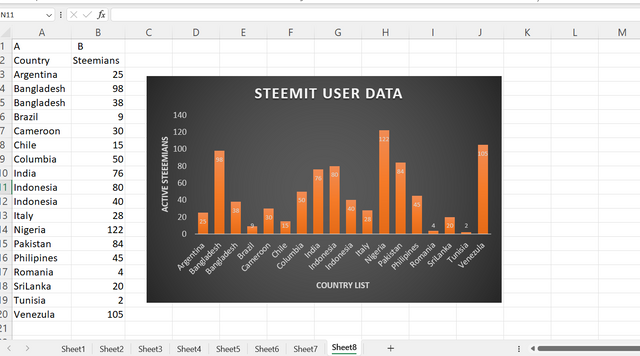
To conclude, In this discussion, we've explored the versatile capabilities of Excel charts and data analysis techniques. We've learned how to effectively organize data for analysis and utilize tools like line charts, bar charts, and pie charts to visualize and interpret information.
By understanding the usability of these techniques, one can gain a more insights from their data and make informed decisions. Whether own a business, student, or researcher, Excel's data analysis tools can empower you to uncover hidden trends, patterns, and correlations within your datasets.
Roundup with this exercise, I would like to invite The following persons participate with me. @chant, @wirngo, and @fombae
Credit to:@rafk
Upvoted! Thank you for supporting witness @jswit.
Downvoting a post can decrease pending rewards and make it less visible. Common reasons:
Submit
This post has been upvoted/supported by Team 7 via @httr4life. Our team supports content that adds to the community.
Downvoting a post can decrease pending rewards and make it less visible. Common reasons:
Submit