Updating the SPY (S&P 500 index ETF) trading at the end of the week.

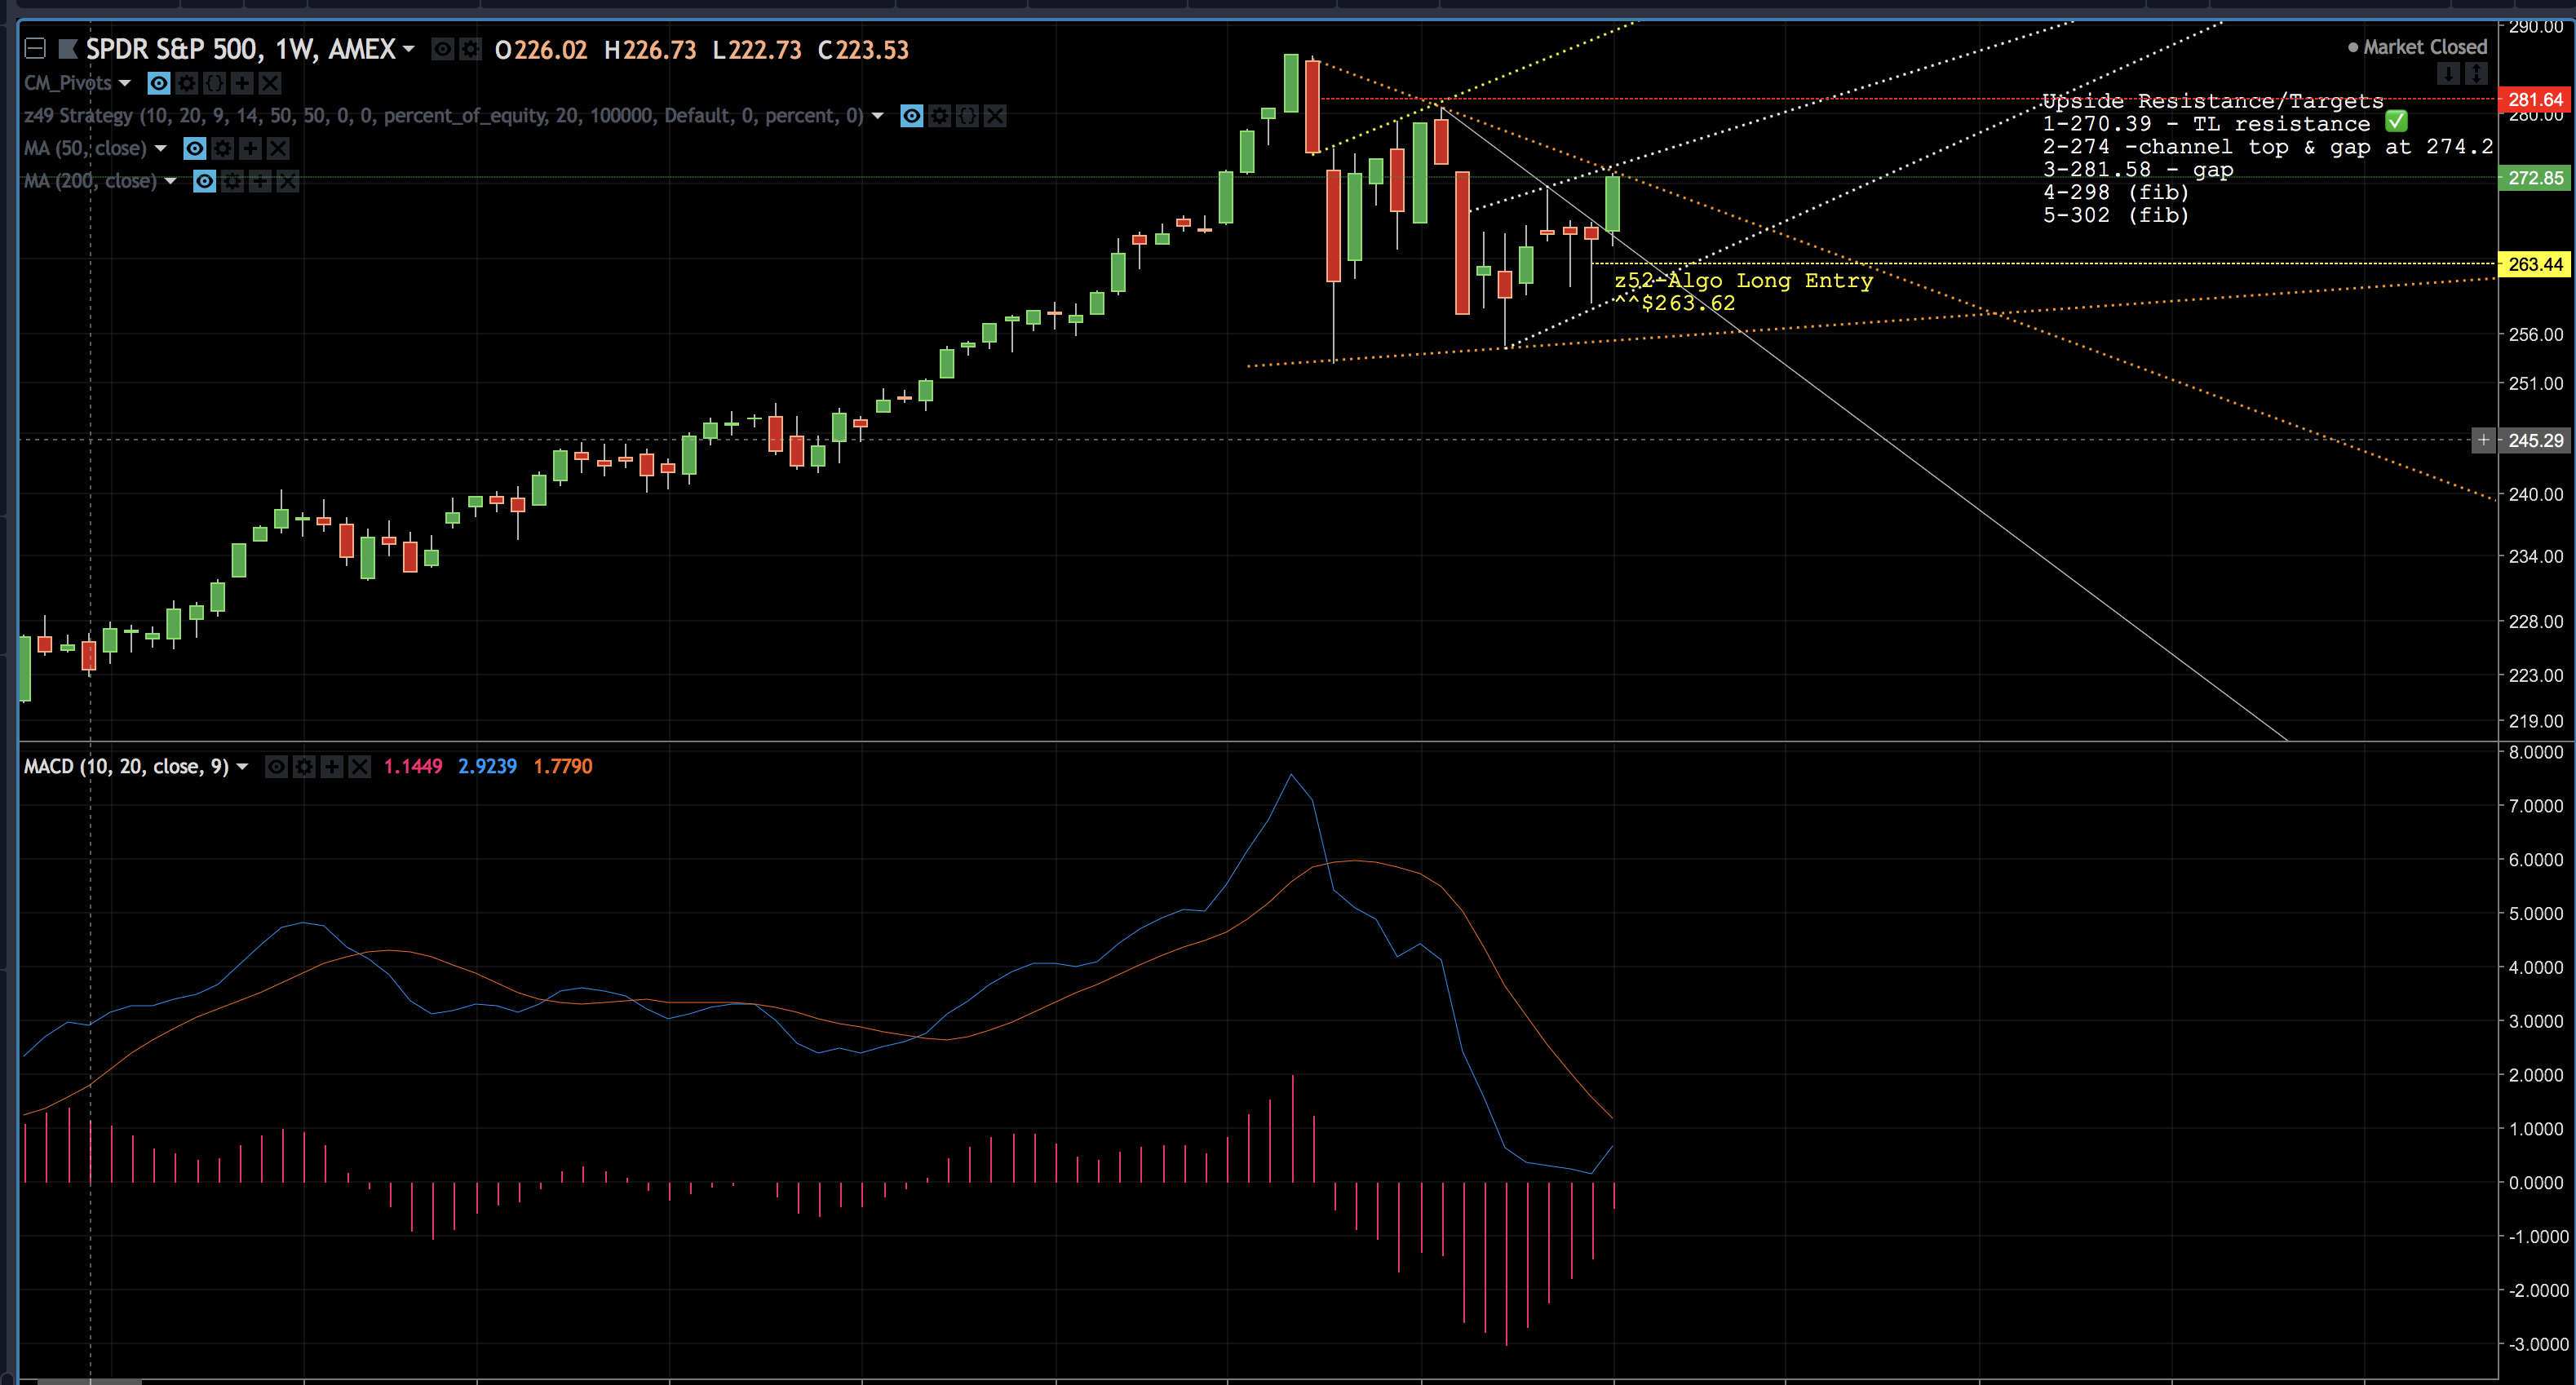
From the weekly angle, that overhead trend line that we closed the week just shy of, is going to be a bit of a headache next week as it coincides with the top of the trend channel around the 274 area.
Of note that weekly MACD is starting to turn in the right direction bouncing off the zero line. As a lagging indicator that won't be useful for another couple of weeks if it does indeed cross over.
There's not much else to focus on in the shorter term tactical trading sense with the weekly chart, but always good to see where you are.
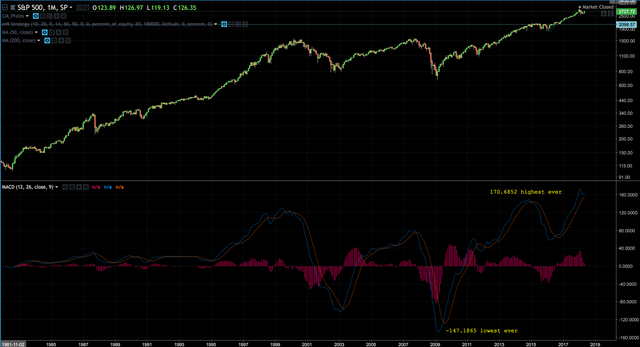
With that in mind I took a look at the historical swings on MACD and the S&P Index dating back to 1991.

Notice that in February 2018 we produced the highest MACD reading in history. Pretty cool to see what trillions of dollars of constant buying will do to a chart...Now I know!
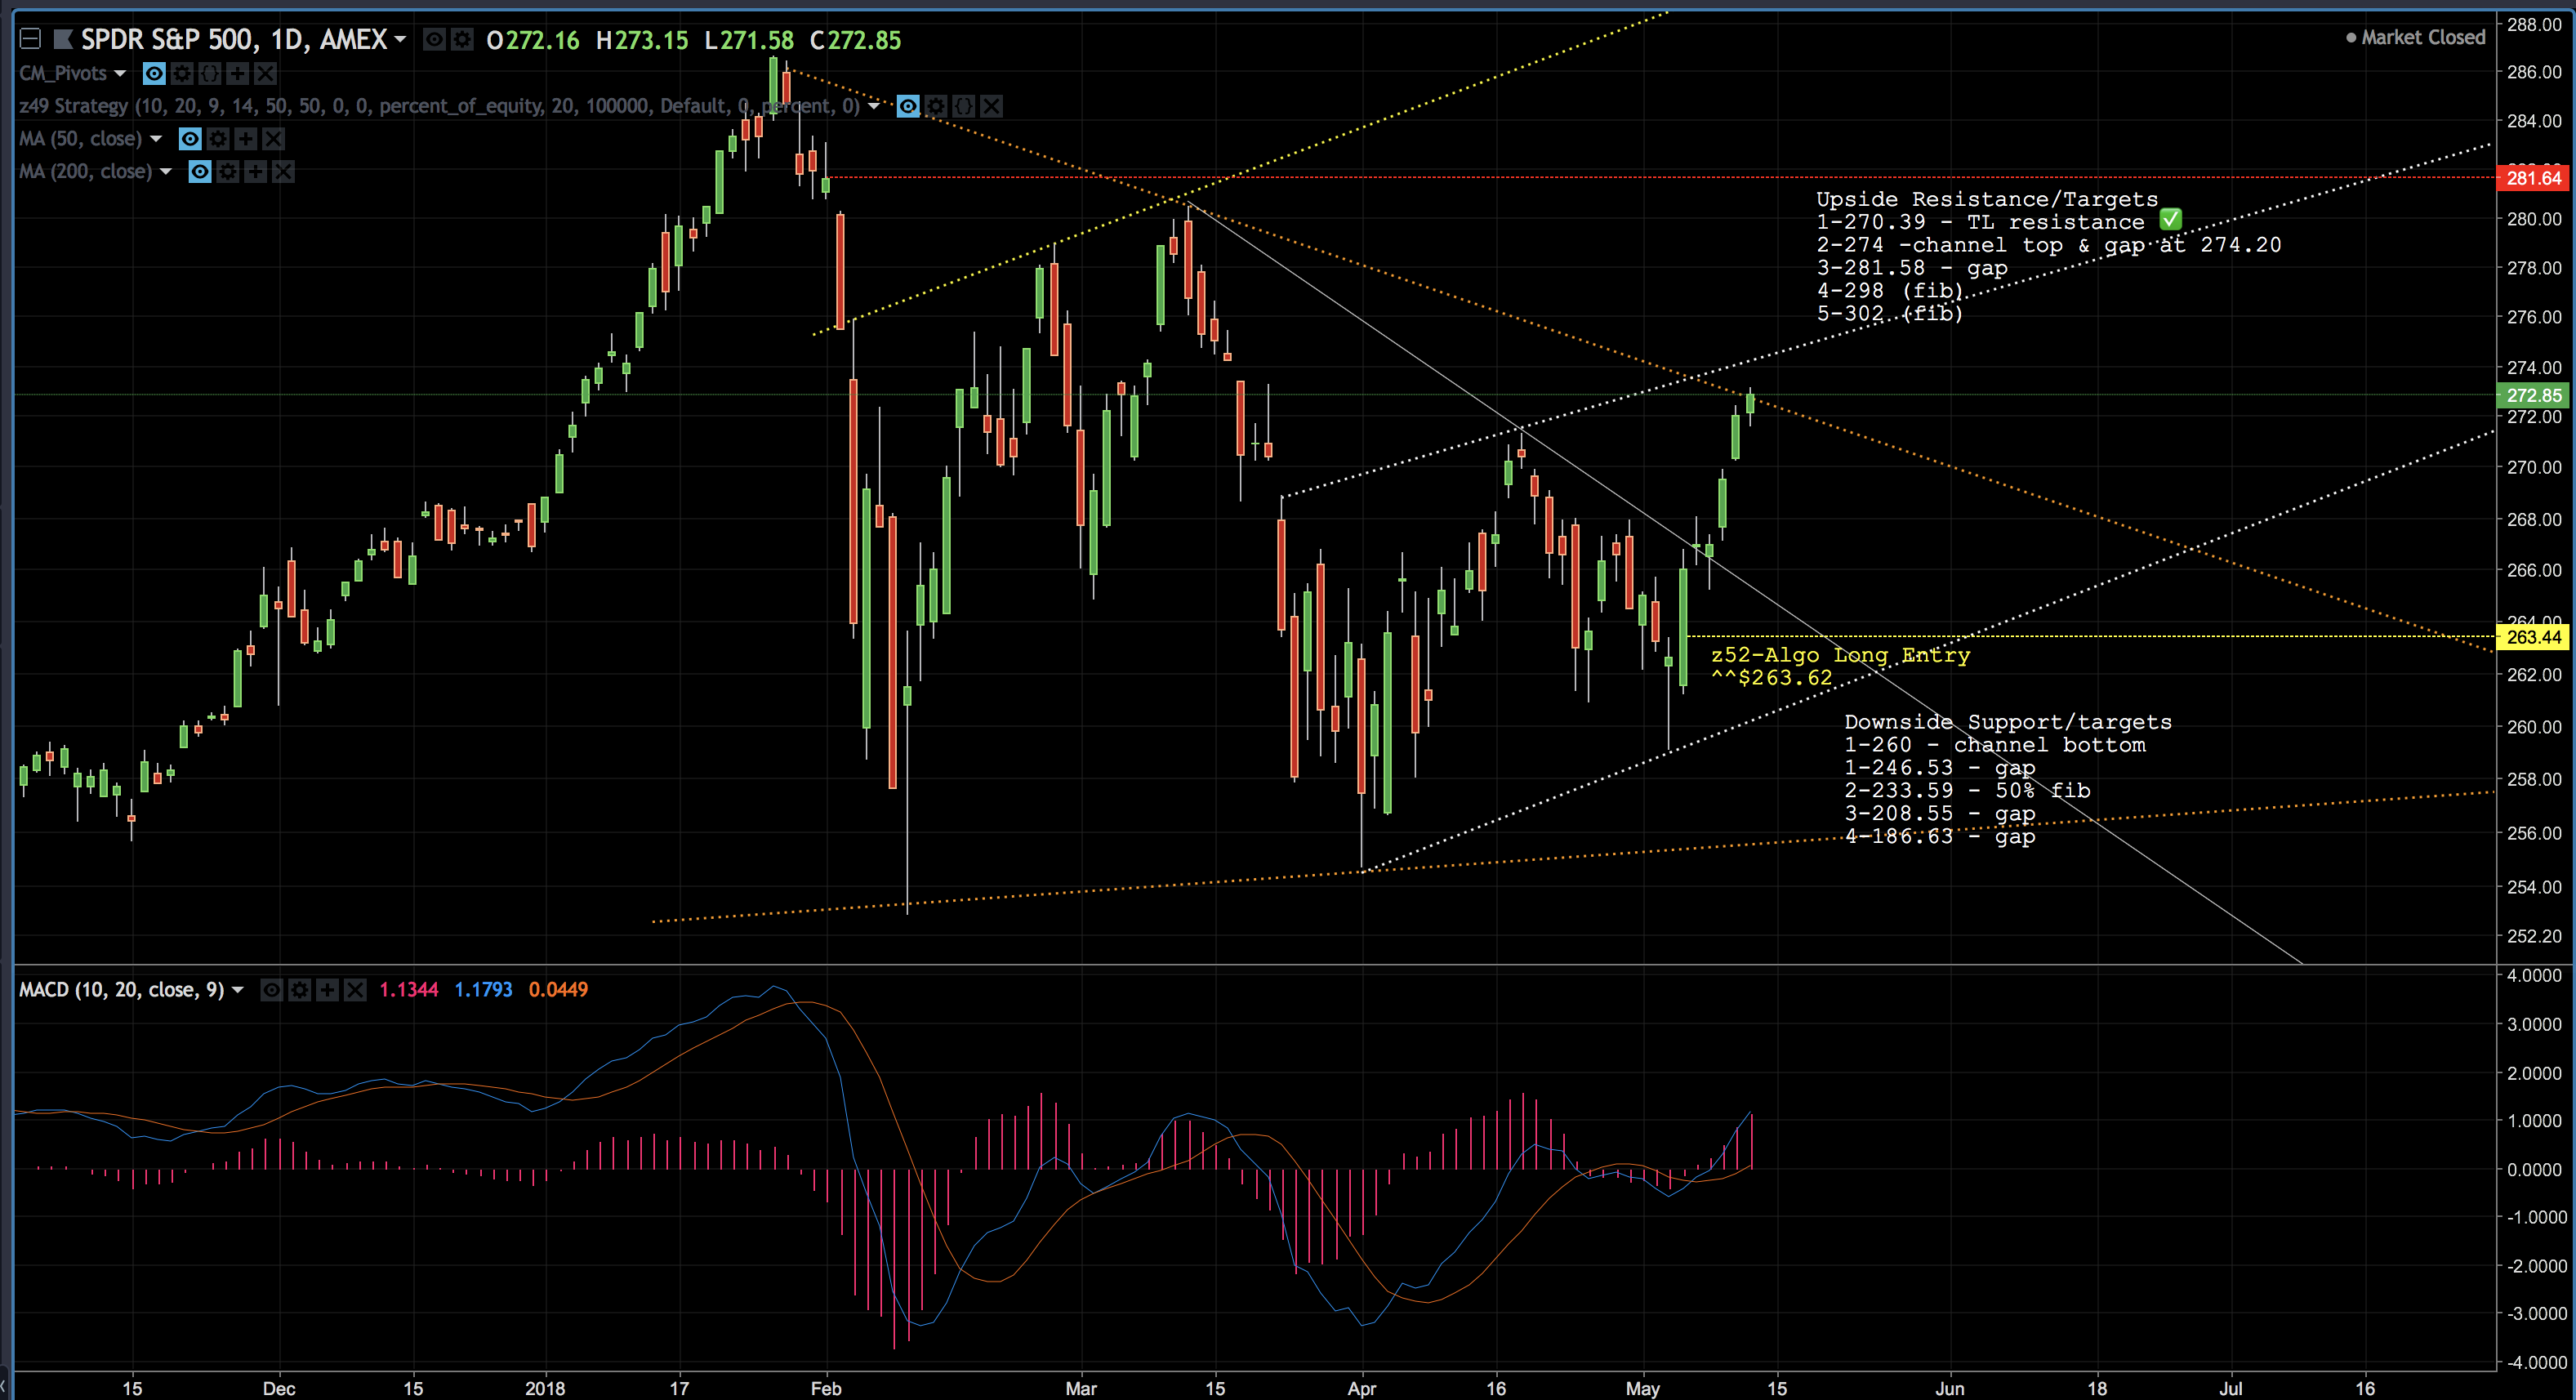
Now on to the more important (for me) daily chart.

Long position was taken at 263 level bouncing off the bottom of the trading channel trend line. From there we moved rather predictably to the top of the channel and the even more looming downward sloping overhead trend line from the January and April highs. As we move up to this 274 price we expect quite a bit of excitement around those trend lines.
Half of the long position was sold on Friday into this price level and we are looking for signs to reverse down to the bottom of the trading channel, again, which would open the door for new lows.
Or more interestingly, we move above the trend channel and the big menacing trend line down and look to get on board with the Russell 2000 and head after those fresh new highs.
I'm straddled long/short at the seams and long from 263 with a lighter position after taking some profits, light on my feet to see what we do from here.
DISCLAIMER
This analysis is circulated for informational and educational purposes only. There is no consideration given to the specific investment needs, objectives or tolerances of any of the recipients. Additionally, actual investment positions may, and often will, vary from its conclusions discussed herein based on any number of factors, such as investment restrictions, portfolio rebalancing and transactions costs, among others. Recipients should consult their own advisors, including tax advisors, before making any investment decision. This report is not an offer to sell or the solicitation of an offer to buy the securities or other instruments mentioned. The research utilizes data and information from public, private and internal sources, including data from actual trades. While we consider information from external sources to be reliable, we do not assume responsibility for its accuracy. The views expressed herein are solely those of the author as of the date of this report and are subject to change without notice. The author may have a significant financial interest in one or more of the positions and/or securities or derivatives discussed.
A bit about me and my trading Journey
How I became a professional trader
https://steemit.com/introduceyourself/@chris-d/how-i-became-a-professional-trader
Trading during 9/11 attacks
https://steemit.com/crypto/@chris-d/short-selling-when-the-world-is-falling-apart
A Day in the life of a professional trader
https://steemit.com/cryptocurrency/@chris-d/the-day-in-the-life-of-a-professional-trader
Congratulations @chris-d! You have received a personal award!
Click on the badge to view your Board of Honor.
Do not miss the last post from @steemitboard:
Downvoting a post can decrease pending rewards and make it less visible. Common reasons:
Submit
Congratulations @chris-d! You received a personal award!
You can view your badges on your Steem Board and compare to others on the Steem Ranking
Vote for @Steemitboard as a witness to get one more award and increased upvotes!
Downvoting a post can decrease pending rewards and make it less visible. Common reasons:
Submit