Performance metrics of top cryptocurrencies in 2017
In 2017 we see huge price rise for cryptocurrencies. Here I will give some performance metrics to summary these huge changes.
Price Data
We consider the top 50 coins in market capitalization in 2017-12-31 from this link in coinmarketcap.com.
Prices are crawled from coinmarketcap.com which contains price roughly every 5 minutes.
We transform the data as follow:
- tether is removed from the list since it's pegged to USD.
- price of veritaseum <= 2017-06-13-02:00:00 is removed
- resample the data to hour
- remove coins with more than 30% missing values(either from missing data or short life time).
Only 30 coins are left after this process. The code for data cleaning is
all_prices['time_'] = pd.Index(all_prices['time']).round('1H').values
all_prices_wide = all_prices.pivot_table(index='time_', columns='symbol', values='price_usd', aggfunc='last')
all_prices_wide = all_prices_wide[top50_symbols]
all_prices_wide.fillna(method='ffill', inplace=True)
all_prices_wide.loc[:dt.datetime(2017,6,13,2):, 'veritaseum'] = np.nan
r = np.log(all_prices_wide).diff()
r = r.loc[dt.date(2017,1,1):dt.date(2018,1,1)]
r = r.loc[:, r.isnull().mean()<=0.3]
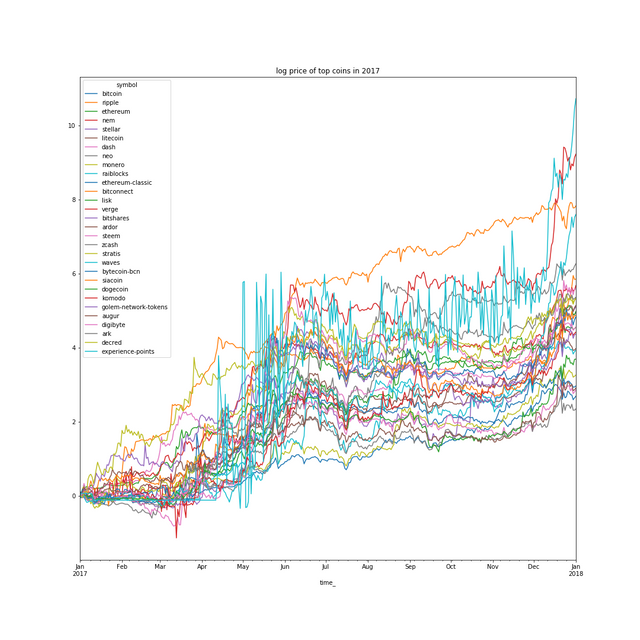
The cumulative log return of these coins are charted below.

Metrics
Since the price range of coins are huge, return is defined as difference in log of price$ r_t = \log(P_t)-\log(P_{t-1})$ . We calculate the following metrics:
- annualized return: average of r times annualization factor T where T is number of samples in a year
- annualized volatility: standard deviation of r times sqrt of T
- sharpe ratio: annualized return/annualized volatility
- max drawdown: the most large price fall in data (measured in log price)
- calmar ratio: annualized return/max drawdown
- up(down) side volatility: rmse of positive(negative) returns * sqrt of T
- sortina ratio: annualized return/down side volatility
Sharpe, calmar, sortina ratio are risk adjusted in the sense of dividing return by some metric for volatility.
You can look up these metrics in google or wikipedia. The definition here may be slightly different from standard usage. The python code to calculate these metrics is
def calculate_performance_metrics(r, annualization_factor=365*24):
        sharpe = (r.mean()/r.std()*np.sqrt(annualization_factor))
        annual_vol = r.std()*np.sqrt(annualization_factor)
        p = r.cumsum()
        annualized_return = r.mean()*annualization_factor
        max_drawdown = (p-p.expanding().max()).min()
        calmar = (-annualized_return/max_drawdown).sort_values(ascending=False)

        n_negative = (r<0).sum()
        n_positive = (r>=0).sum()
        vol_negative = np.sqrt(((r[r<0])**2).sum()/n_negative*annualization_factor)
        vol_positive = np.sqrt(((r[r>=0])**2).sum()/n_positive*annualization_factor)

        sortina = annualized_return/vol_negative

        stats = pd.DataFrame({
            'return': np.exp(annualized_return)-1,
            'volatility': annual_vol,
            'upside_volatility': vol_positive,
            'downside_volatility': vol_negative,
            'max_drawdown': np.exp(max_drawdown)-1,
            'sharpe_ratio': sharpe,
            'calmar_ratio': calmar,
            'sortina_ratio': sortina,
        }
        )
    return stats
Result
You can access the result in this spreadsheet.
Top 5 in sharpe rato are: ethereum, ripple, dash, bitconnect, nem. Top 5 in calmar ratio are bitconnect, verge, decred, bitcoin, dash.
Feel free to explore these metrics. But note historic metrics may not be indicative of future performance.
good job!
Downvoting a post can decrease pending rewards and make it less visible. Common reasons:
Submit
Very cool. So steem is not alone in rising.
Downvoting a post can decrease pending rewards and make it less visible. Common reasons:
Submit
Thanks for the information
Downvoting a post can decrease pending rewards and make it less visible. Common reasons:
Submit
nice I follow YOU..
Downvoting a post can decrease pending rewards and make it less visible. Common reasons:
Submit