HOLA GO ZENers!
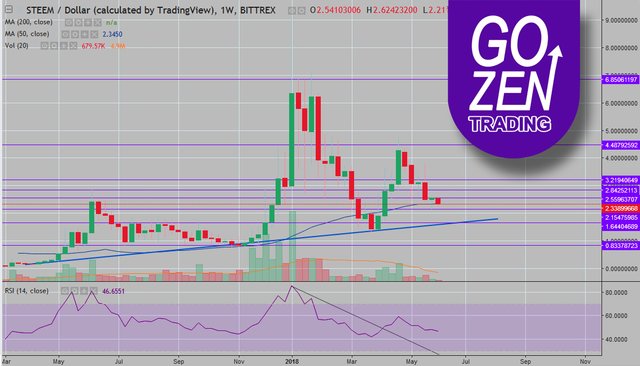
This is the WEEKLY CHART (LONG PERIOD) 1 caldle = 1 week

As you can see we got here a solid trendline (blue line) with 3 points of contact :
1- Point of contact from March 2017
2- Point of contact from November 2017
3- Point of contact from March 2018
And...considering solid trendlines like this works like MAGNETS, we need to be prepare to see the price testing for the 4th time the blue trendline, even because is correlated with a critical zone at 1.64$.
Sound pretty bad, but...it is not! Because is going on a creation of a DOUBLE BOTTOM PATTERN or... if you prefer a "W" pattern, right now the pattern formation is around 80%. We have already completed the NECK of the pattern around 4.48$ . So is necessary the price get that 1.64$ target.
After that we need to wait to confirm that the blue trendline is strong enough as a support to project the price at least toward the NECK of the pattern (4.48$)
and hopefully continue the projection to next levels around 6.8$
Remember this is a weekly chart and every candle is 1 week. Means the price might require at least 2 month to get the target .
By now let's GO ZEN (be patient) and wait the "W" pattern will be complete and re-evaluate the critical zone to GO long around 1.64$
Have a good day and great profit!
GO ZEN!

Watch also:
CRYPTO TRADING LESSONS FOR BEGINNERS
https://steemit.com/dlive/@gozeninvesting/a2c40300-6456-11e8-b143-ffce16c65548
GO ZEN Investing
is about : Crypto Trading , Blockchain, News and Technical Analysis Lessons.
GO ZEN Investing by Rodolfo Crisafulli
Buy cryptocurrencies:
https://www.coinbase.com/join/5a3448b77d3d1305dcd4cd2d
Track ICO Graphically: https://icotracker.org
Thank you for your support!
INVESTING IN CRYPTO ONCE AGAIN!!

SOCIAL MEDIA:
https://steemit.com/@gozeninvesting
https://www.facebook.com/gozeninvesting/
https://www.instagram.com/gozeninvesting/
DISCLAIMER: This is NOT financial advice. This is just my opinions. I am not responsible for any investment decisions that you choose to make.
