Русскую версию смотрите здесь.
Honestly, there are a few Steem-tokens in my investment portfolio but I never considered them for active trading and probably I regret about it because STEEM behaves quite technically.
First, let's look at the whole trade history of STEEM
We can see that the coin was in a dramatically falling for 100 days and only by November 2016 it managed to find a certain bottom at the level of 0.00013000. After that, then descend briefly to 0.00005570, but very quickly returned to its previous level of 0.00013000 and did not sink much lower below. Therefore, we have reason to consider the resistance/support level at 0.00013000 as fundamental and very strong.
Let's look closer,
We may see another level of resistance/support formed during the spring sideways - 0.00022700, after which the price chart drawing something very similar to the figure "head and shoulders", which is generally a reversal, a fairly strong figure, and the higher the head, the figure is stronger, but here it is quite high.
After the penetration of the neck, this figure began to go to its target level, which is potentially around 0.00005570
However, not everything is so bad! The fact is that the decline is not confirmed by growing volumes. And in recent days, volumes are just mega low (see picture below)
If you look at the Fibonacci levels,
We will see that the price was stuck between the Fiba level of 0.00027500 and the previously indicated support level of 0.00022700
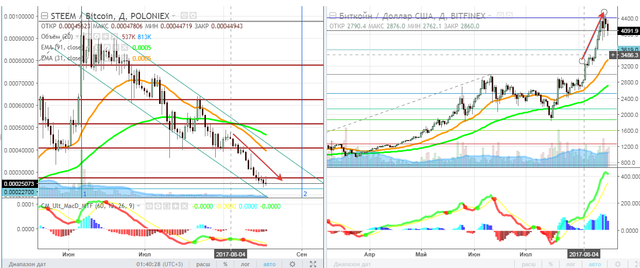
At the same time, if you will look at the last BTC / USD chart and compare it with STEEM / BTC

Then we will see that before 04.08.2017 the graphs were not very correlated, i.e. STEEM fell just on the background of correction after the spring rally, although the cue ball at that time felt "not nice". However, after 04.08.2017 their dynamics began to mirror each other (marked with red arrows), which speaks already of the speculative sale of STEEM in order to earn money on the cue ball. It follows that as soon as the cue ball's growth slows down and leaves at least a little laterally, probably some traders will return to STEEM and chase it up.
Conducting candle analysis, you can not help noticing two candles at the peak of the pair BTC / USD.
If today, on August 19, the next black candle comes out, it will be like three black crows, which are a reversal indicator. By this time, possibly MACD will also give a reversal signal at the intersection of its moving averages from top to bottom. Therefore, the growth of the BTC rate in the very near future is not so obvious.
It's time, to sum up.
I am surprised, but quite often the Fibonacci time lines coincide with the turning points on the chart, The first such line falls on August 31, 2017 Consequently, some serious movements should be expected in the vicinity of this date (the error is possible in the region of + -2 days). Therefore, I give the forecast conditionally to 31.08, and closer to the case, I will correct it if necessary, but if I really want, it's already possible to make small purchases of STEEM now, although it is better to wait for additional signals to turn around.
My goals for STEEM as of August 31, 2017
positive forecast 0.00041 (less likely)
neutral forecast - a flat in the corridor 0.00022 -30 (most likely)
negative forecast - correction on the lower line of the channel to the level of resistance 0.00013 (unlikely)
Good luck and good profits for all!
Regards,
Mikhail Hyipov
If you liked the article, support the author, subscribe to @hyipov
Your support is very important to me!
Disclaimer: No information presented in this article is a guarantee of obtaining a certain return on investment as well as a guarantee of stability in the amount of possible costs associated with such investments. Materials should not be considered as informing about possible benefits. A certain profitability in the past is not a guarantee of profitability in the future. The responsibility for making an investment decision as well as the risks of losses each takes on itself.
Afterword
*Analytics uses analytical tools provided by tradingview.com
**As a token of gratitude and mutual support, each subscriber for the repost of this post will be transferred 0.1 SBD!


I'd just like to say thank you for not pumping ridiculous predictions saying "to the moon" and then disappearing when it goes to the ground.
Great charts and explanations.
I posted something almost simultaneously, though more about how it's lost it's luster for me personally instead of a full analysis.
Downvoting a post can decrease pending rewards and make it less visible. Common reasons:
Submit
@wetthebeak many thanks for your nice words. I really appreciate it! :)
Downvoting a post can decrease pending rewards and make it less visible. Common reasons:
Submit
Downvoting a post can decrease pending rewards and make it less visible. Common reasons:
Submit
Подписка и апвойт)))
Downvoting a post can decrease pending rewards and make it less visible. Common reasons:
Submit