Hello Steemers!

Some hardcore pumps and volume ;) Really nice to see some positive moves on the charts after such long downtrend!
POLONIEX

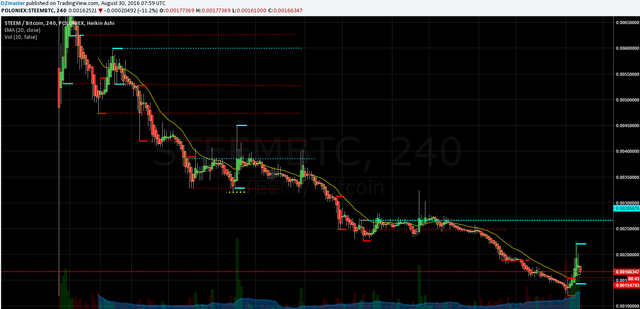
4 hour Poloniex chart - Aug 29, 2016

4 hour Poloniex chart - Aug 30, 2016
The price made a wild bounce breaking through the first resistance line like through butter.
It spiked through the 2nd resistance line and came all the way up to ~0.002 BTC.
After the sudden increase it started to come back down slowly making its way towards the first support line (the new swing low that i marked).
BITTREX

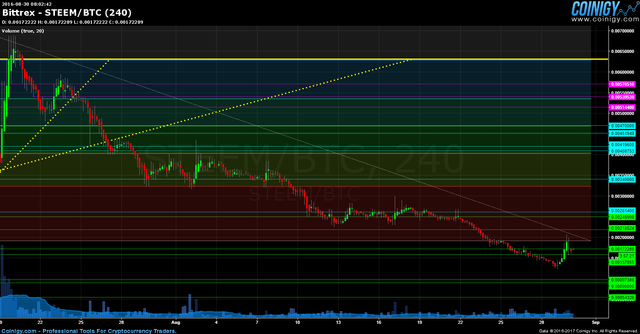
4 hour Bittrex chart - Aug 29, 2016

4 hour Bittrex chart - Aug 30, 2016
The Bittrex price also had some wild pushes, spiking back through the first fib line, but getting kicked back down after.
Now it seems to be trying to make a new support level around the ~0.00158 BTC line.
VOLUME COMPARISON

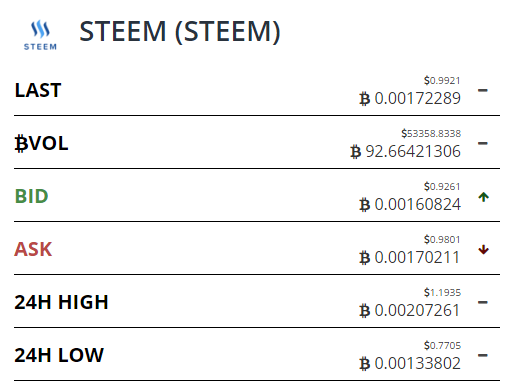
STEEM/BTC volume Bittrex Aug 29, 2016

STEEM/BTC volume Bittrex Aug 30, 2016

STEEM/BTC volume Poloniex Aug 29, 2016

STEEM/BTC volume Poloniex Aug 30, 2016

STEEM indexed global volume Aug 29, 2016

STEEM indexed global volume Aug 30, 2016

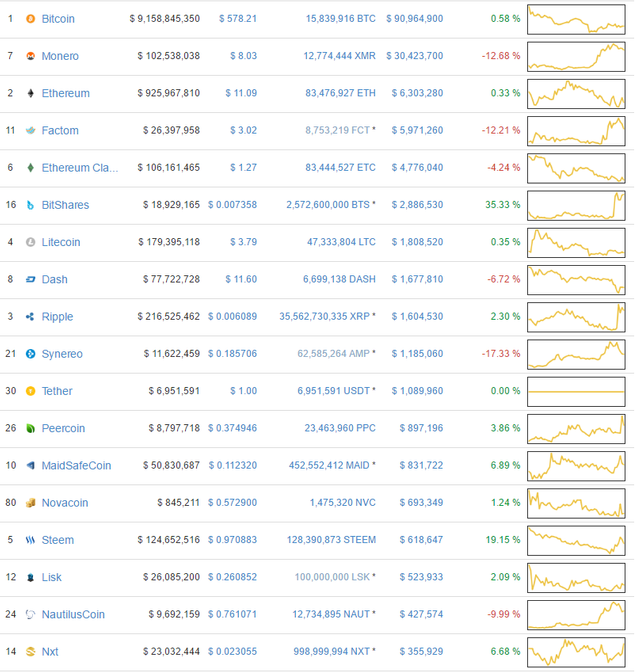
Coinmarketcap top volume cryptos Aug 29, 2016

Coinmarketcap top volume cryptos Aug 30, 2016
The Poloniex volume doubled while the Bittrex one only had 20 btc added to its volume, Polo showed why coins wanna get listed on there!
Although the overall volume doubled, STEEM didn't move many places up on the list compared to other cryptos, seems alts being in pump mode :)
COMMENT
Once again, I will post the comment by commenting as it involves my personal opinion!
Thank you for understanding!
If anyone has any questions or need's help fell free to ask, I will try to explain as fast and as best as I can.
Critics, comments, reply's, counters, advice's, etc. are always welcome!
Have my charts helped you in any way?Let me know with a comment below :)
Are there more people who are doing TA?
Please post the links to your TA's posts into the comments as well!
DISCLAIMER
I am showing multiple scenarios on the price movement, in the post itself I do not take any stance, either bullish or bearish. I am not responsible for neither you’re winning nor you're losses upon trading! the "comment" section is my personal opinion and does not mean I have to or do hold any positions in the given market.
Kind Regards, OZ :)
COMMENT
I think this was the mark of the bottom and the start of an uptrend.
I can't yet tell if I expect a hard uptrend and heavy pumping or slow accumulation along the levels.
From personal experience I'd lean towards the accumulation option more, would expect the price to rise slowly making stops at similar levels as in the downtrend in order of more accumulation.
Of course there is still downtrend potential, but as mentioned yesterday, in my eyes, it's diminishing as the days go by
Downvoting a post can decrease pending rewards and make it less visible. Common reasons:
Submit
I think this is most likely a little breather on the way down to $0.50
Downvoting a post can decrease pending rewards and make it less visible. Common reasons:
Submit
I want you to be wrong but I fear you are right.
Downvoting a post can decrease pending rewards and make it less visible. Common reasons:
Submit
This is such great news and relief. Finally a bounce from all the downtrend we've been seeing for quite some time. Going from $0.70s to $0.90s is simply amazing! Thanks for the analysis as always!
Downvoting a post can decrease pending rewards and make it less visible. Common reasons:
Submit
In all the years I have been looking at charts and trading. When something is in a heavy down trend and the only up moves are sharp spikes the direction is usually still down. Hoping we see a bottoming process here to get us out of that downtrend/boom route.
Downvoting a post can decrease pending rewards and make it less visible. Common reasons:
Submit
As always a great update @ozchartart
I agree, there are the first signs of some positive moves which is nice to see.
Downvoting a post can decrease pending rewards and make it less visible. Common reasons:
Submit
Nice analysis, thanks info @ozhcartart
Downvoting a post can decrease pending rewards and make it less visible. Common reasons:
Submit
Thx for your technical analysis.

I describe my idea below:
The large volume on down bars tells us that bear trend will continue. At the previous session, we have not reached a little bit the level of resistance - 0.00226527. We have reached the 100 day moving average and remained under it. The resulting 4 hour pin-bars chart shows that consolidation above the level of 0.0017 won`t happen in the near future.
Test of the level of support - 0.001757 will lead to break through the ascending levels of the triangle, and then we'll go to test the support level of 0.001228
Volatility is on the peaks, indicating the possibility of a strong movement.
Aim: 0.001228
Resume: Sell
Downvoting a post can decrease pending rewards and make it less visible. Common reasons:
Submit