Follow me @steemcharts for daily updates on Steem prices, Bitcoin Prices, Steem statistics and Technical analysis.
Please leave a comment and an upvote as well! Also, let me know if you have any wishes for charts that I should do.
Disclaimer: This is not investing advice. These charts are for fun and beginners. An easy to understand basic introduction to charts.
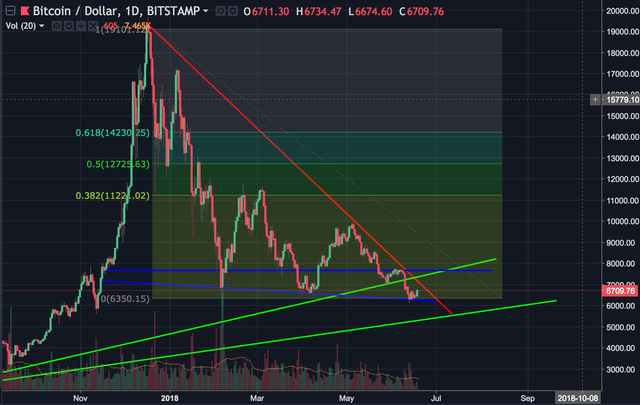
BTC

Once again a lower low after many lower highs as well. The area we of resistance that I think we have to be able to rise above is now $7700USD. Unless we do that, and get ourselves over that blue support line once again, out of the red bearish trend and back onto the ascending bullish geen trendline on some decent volumes, I'm afraid we will continue lower. $5000 area is the most $5300 area is the most likely.
We did see some strength yesterday, but possibly just a bull trap. Wether or not the market is manipulated, a lot of people has lost interest. And frankly, we are seeing how very early we are. No one is using Dapps. Is it because it's too early, or is it because no one cares about decentralization? Time will tell. Cryptos will play a role in the future, Blockchain will of course revolutionize the world - but blockchains doesn't have to be decentralized. The question is how large the free decentralized market will be. It will be a place where you can make a lot of money, but also lose a lot of money. As for investing, I think 90% of all Dapps and utility tokens will be utter worthless in a year or so.
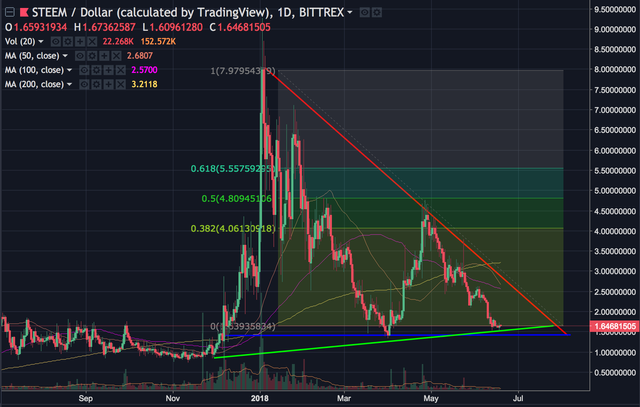
STEEM

Steem on the other hand is not a Dapp, it's a protocol and a well functioning blockchain (with some problems of course) and the price has been ripped completely. We are below all moving averages, at the bottom of the fib retracement, hitting long term ascending trendline. But, keep in mind, Steem was around $0,1 for a little over a year ago. So I would not be surprised is Steem continued much lower, at least below $1 if this bear market continues.
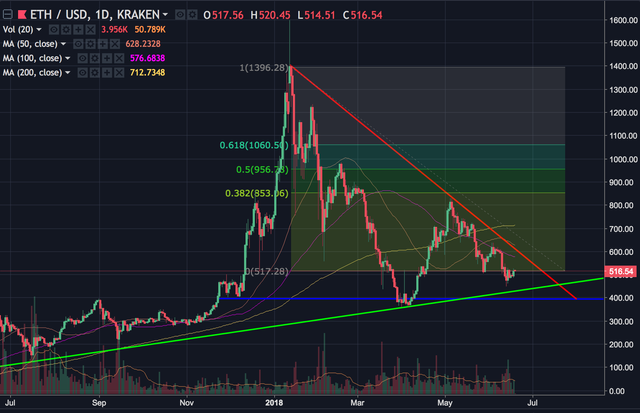
ETH

Little bit the same story with ETH, as we are hitting that long term ascending bullish trendline.
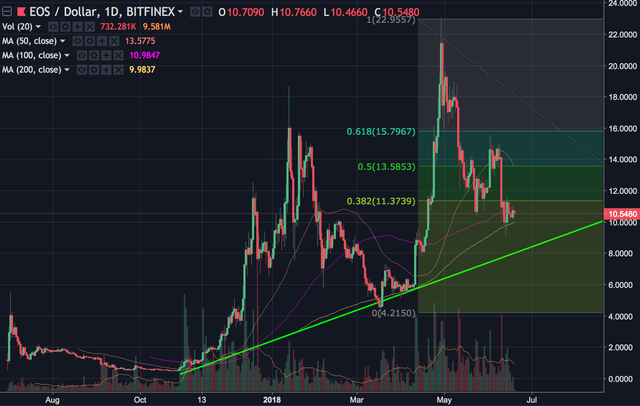
EOS

EOS has hit 200 day moving average but is still way above the green line we could start calling a ascending bullish trend line. EOS has had some problems, but as it turned out it was mostly FUD from haters - and these functions were built in protection systems that prevented EOS from doing hardforks.
Follow me @steemcharts for daily updates on Steem prices, Bitcoin Prices, Steem statistics and Technical analysis.
Please leave a comment and an upvote as well! Also, let me know if you have any wishes for charts that I should do.
Disclaimer: This is not investing advice. These charts are for fun and beginners. An easy to understand basic introduction to charts.

Welcome back!
Downvoting a post can decrease pending rewards and make it less visible. Common reasons:
Submit
Thank you!
Downvoting a post can decrease pending rewards and make it less visible. Common reasons:
Submit
I am your new follower happy to see you there... 🙂
Downvoting a post can decrease pending rewards and make it less visible. Common reasons:
Submit
Thanks! Happy to see you as well!
Downvoting a post can decrease pending rewards and make it less visible. Common reasons:
Submit
Coins mentioned in post:
Downvoting a post can decrease pending rewards and make it less visible. Common reasons:
Submit