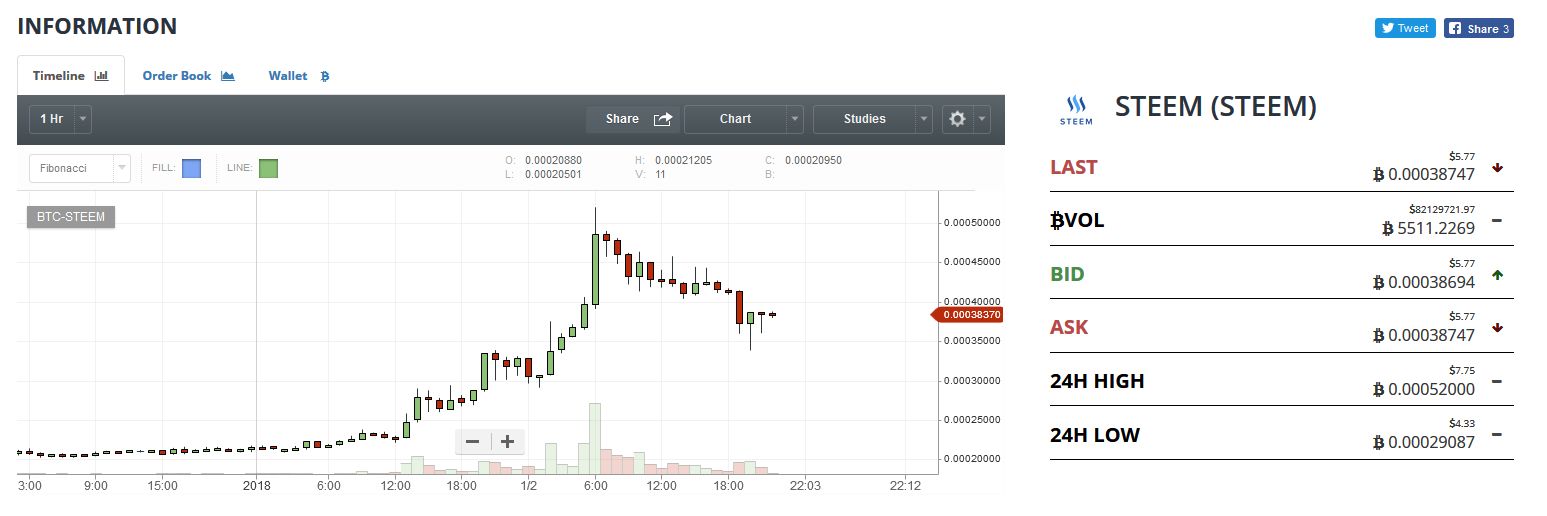
We are all excited to see Steem steaming up. Lets look at this move with some analysis.
First I want you to look at this blank 1 hour chat and feel these candles.

You got no clue, right? In the end of your feeling is the doubt, is it going up or down? If you never did any investing this all might sound and look confusing. Green, red candles going up and down. Where is the order in that?
Truth is, there are countless studies that help us determine if the price is good for us, so we can jump in, or it is good for us so we can jump out.
Now lets go to improved chart.

So, first things you notice are the dots under and above candles. This study is called Parabolic SAR and it shows price trend and all its levels. For beginners, if Parabolic SAR is under the candles, price is moving up, if its above, its going down. In Steem's case, it looks like PSAR is forcing price to go down but if you look closely you will see that the downswing is slowing down. How do I see that? Well, downswing started when price hit the roof around 50 000 satoshis. From there, there was a strong will to put the price down.
The Fibonacci move, it is also a study, help us here. Before you continue reading I advise you hit search engine and find relevant sources to understand Fibonacci sequence and its usage in trading. Here I will explain in short. Fibonacci study in trading helps us to determine where was the force of a move, how it will trace and where it will end. Extremely important. In Steems case, price is stable around 38 000 satoshis and is looking to go up if it is supported by Volume.
Williams%R levels are also low. This study help us determine if Steem is overbought or oversold. Right now it is just above the oversold levels and is stabilizing.
Elder ray is coming out from the downswing and in MACD EMA is about to meet the signal line. This is the crucial moment.
I am positive :)
Go STEEM