Timeframe: Daily
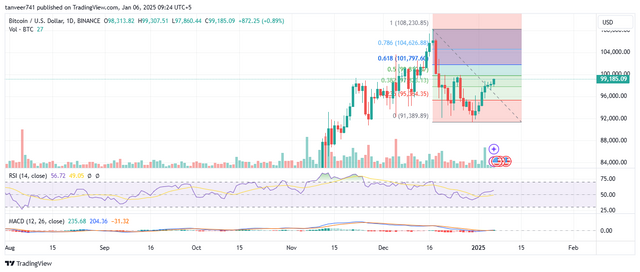
BTC/USD is in a recovery phase after a pullback from the $108,230 high. Current price action suggests a bullish attempt to reclaim key Fibonacci levels, with price approaching the 50% retracement level at $99,185.
Major Support and Resistance Levels:
- Resistance: $101,797 (61.8% Fibonacci level) is the next key hurdle, followed by $104,626 (78.6% Fibonacci level).
- Support: Immediate support lies at $95,304 (38.2% Fibonacci level), with stronger support at $91,389.
Volume Analysis: Gradually increasing volume during the recent recovery indicates growing bullish interest, suggesting buyers are stepping in at lower levels.
RSI: RSI stands just above 50, showing bullish momentum is building but not yet overbought, leaving room for further upside.
MACD: A bullish crossover is evident, with MACD lines moving above the signal line, confirming strengthening bullish momentum.
Potential Targets:
- Upside: A breakout above $101,797 could push BTC toward $104,626 and possibly retest $108,230.
- Downside: A failure to sustain above $95,304 may result in a retest of $91,389.
Disclaimer:
I analyzed the price chart on TradingView and refined my writing with ChatGPT. This analysis is for informational purposes only and not financial advice. Please conduct your own research before making any trading decisions.