This is the technical analysis on ETH/BTC pair. Enjoy!
My Chart Setup and Technical Analysis Indicators:-
Chart: Candlestick Charting Period: Daily (Long Term Chart) 4 Hours (Medium Term Chart) 1 Hour (Short Term Chart)
Indicators that I am using:-
1. Bollinger Bands:- Length: 21 Standard Deviation: 2 2. Linear Regression Channel (LRC) 3. Simple Moving Average (SMA):- Dark Blue: 84 (Long Term Trend) Blue: 63 (Medium Term Trend) Light Blue: 21 (Short Term Trend) 4. TrendLines
Some Technical Terms:-
Bullish (Upward Trend): The past price actions indicate that the price could go up.
Bearish (Downward Trend): The past price actions indicate that the price could go down.
OverBought: The past price actions indicate that the traded pair is overvalued (eg: due to hype) and may pull back.
OverSold: The past price actions indicate that the traded pair is undervalued (eg: due to panic selling) and may trend up.
Sideway: There is no clear indication on where the price is heading.
Support Level: A floor level where the price tends to bound off. However, if the price has breached this level, the down fall could continue until the next support level.
Resistance Level: A ceiling level where the rising price tends to bound off. However, if the price has breached this level, the upward trend could continue until the next resistance level.
Cryptocurrency Pair: ETH/BTC
ETH/BTC Daily Chart (Long Term)
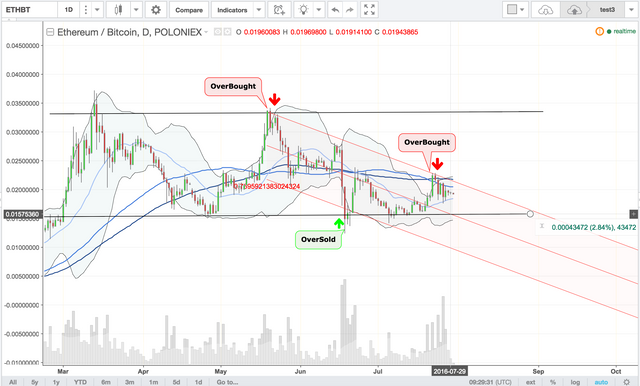
There are 3 signals that indicated the pair have either been overbought or oversold on the daily chart. The First signal is on 19/20 May 2016 which the price went up way outside of the upper Bollinger band (OverBought). Eventually the price went down back to the center line for both the Bollinger bands and also the LRC. The Second signal is on 19/20/21 June 2016. You can see the price has touched the bottom lines for both the Bollinger bands and also the LRC. This is an indication that the pair has been oversold. It is just a matter of time that the price will go back which happened after a few days. The Third signal is an interesting one. It happened on 22/23 July 2016. There are actually 3 different conformations that the pair has overbought. The First 2 confirmations are the upper lines of the Bollinger Band and also the LRC. The Third indication is the 63 SMA which crossed downward the 84 SMA. This is an indication that the trend is Bearish. The Third signal is stronger than the First and the Second because there are 3 confirmed indicators that suggested the download trend. The Third signal suggested that price could trend further downward to 0.01568. The Support level on the daily chart: 0.01568 The Resistance level on the daily chart: 0.03333
ETH/BTC 4Hours Chart (Medium Term)
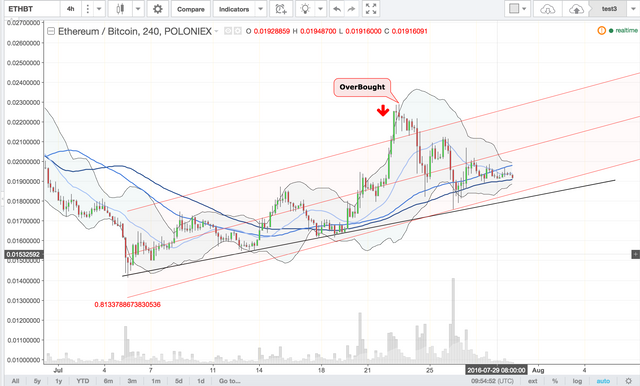
On 22 July 2016 4/8 pm, there is a strong signal that the ETH/BTC has been overbought because the price has travelled outside of the the upper line of Bollinger bands and and LRC. So, the price eventually went back down to the center of the LTC before bounding off to the center of the Bollinger bands. On 29 July 4 pm, the 21 SMA has crossed downward the 63 SMA which is Bearish signal. But only 1 indicator confirmed this Bearish trend. So, trade with cautious.
ETH/BTC 1Hour Chart (Short Term)
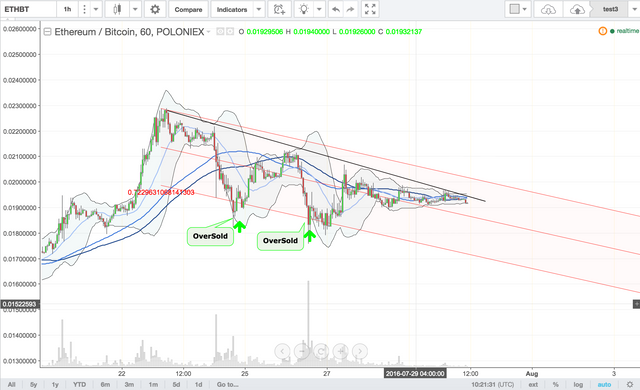
As for the 1 hour chart, there are 2 strong signals that the pair has oversold. The First signal was on 24 July 5 pm and the Second signal was on 26 July 12-1pm. Eventually the price went back up after the traders realised the trend. The price on 1 hour chart has been moving side way in the last 3 days.
Summary for ETH/BTC Technical Analysis on 30 July 2016
ETH/BTC has been trending downward on the daily chart with the support level (0.01568) and resistance level (0.03333). There are 3 indicators that the downward trend will continue to reach the support level of 0.01568. For the 4 hour chart, there is only 1 indicator that it is a downward trend. But for the 1 hour chart, the price is moving sideway. Since the daily chart has 3 indicators for the downward trend, there is a high chance that the 4 hours and 1 hour chart will follow a downward trend as well.
Disclaimer:-
Technical analysis is about studying the past price actions and trends. The past does not equal to the future. The past price actions can only act as indicators for the potential future trend. Use the above information at your own risk. Please consult your professional advisor before making any trades.
If you like this technical analysis, please up vote and give comments below. :)
Please let me know which other cryptocurrency pair that you want to be analysed and I would try my best to do it during my free time. No promise though. ;)
Click my name cooldude ↓ and click Follow, if you don't want to miss any of my analysis.
excellent analysis. good job!
Downvoting a post can decrease pending rewards and make it less visible. Common reasons:
Submit