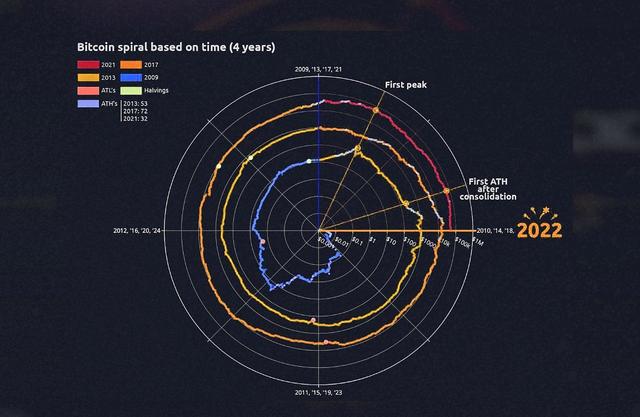
Bitcoin has given us 32 blue dots (historic ceiling) so far in 2021. Examining the chart, we find that in the 2017 period, we had 72 historical ceilings and in the 2013 period, we had only 52 historical ceilings.
It remains to be seen what will happen in 2022.
What are your predictions?