Steem Observatory update - Auto refresh, votes per hour bar graph, Material Design
It’s been two days, so it’s time for another Steem Observatory update!

New features
Auto refresh
You can now activate an auto-refresh toggle to make Steem Observatory automatically load new data from Steem every 60 seconds. This updates everything in the app, so if you are looking at a chart and new data comes in from the Steem blockchain, that updates live as well.
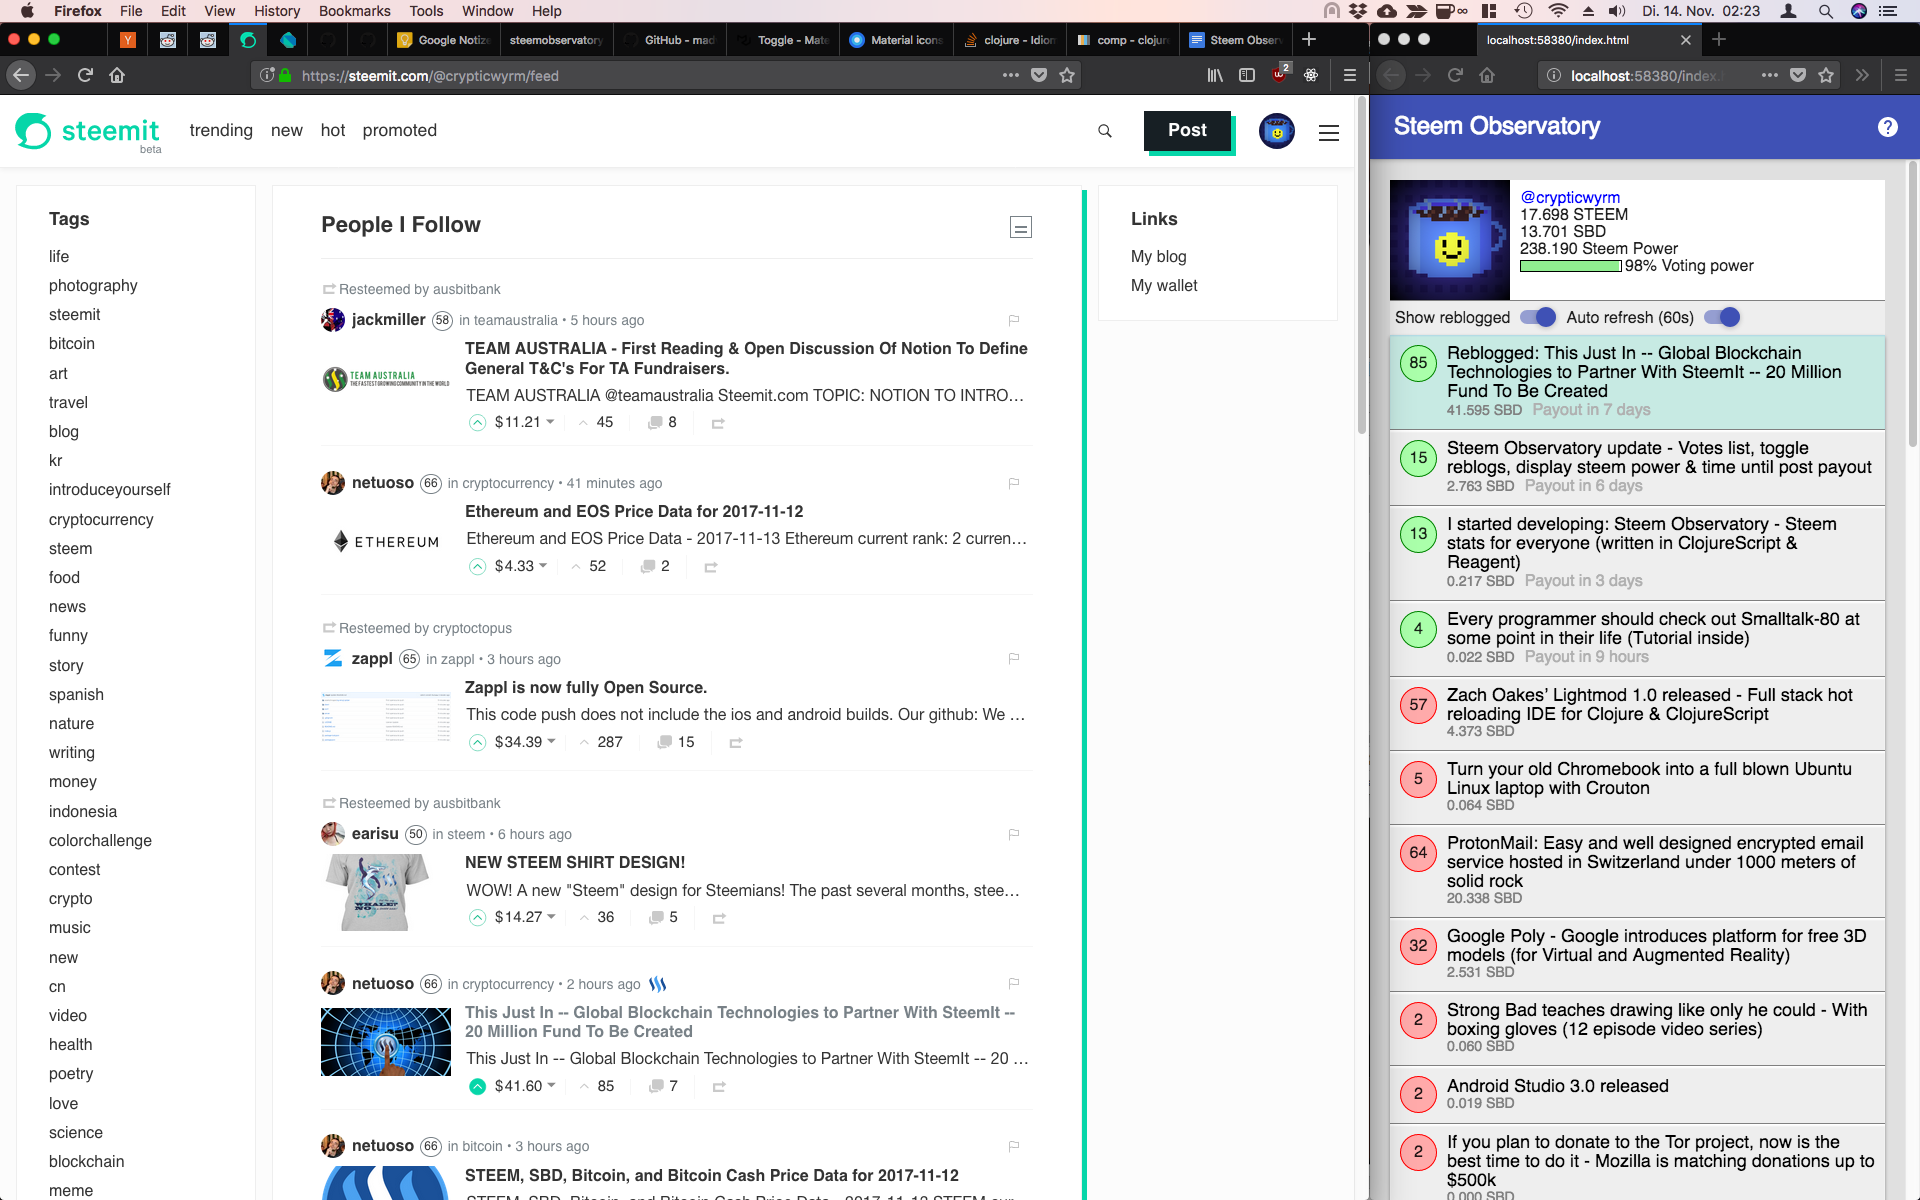
Thanks to this you could now also move Steem Observatory to the side of your screen as a small window and just watch as new votes for your posts come in while you’re doing something else on your computer, like browsing Steemit.com ;)

Keep in mind that Steem Observatory is in a very early development stage, so things could break, this feature hasn’t been tested thoroughly yet under different conditions (like Steem’s API misbehaving if it’s under too heavy load). So if you notice the site stops auto refreshing, just reload the site manually and it’ll work again. In theory everything should work fine though.
If you know your way around the developer console in your browser, Steem Observatory logs refresh messages so you can check there if it’s working or not or if there was an error (please report to me in the comments if you notice one!).
Votes per hour bar graph
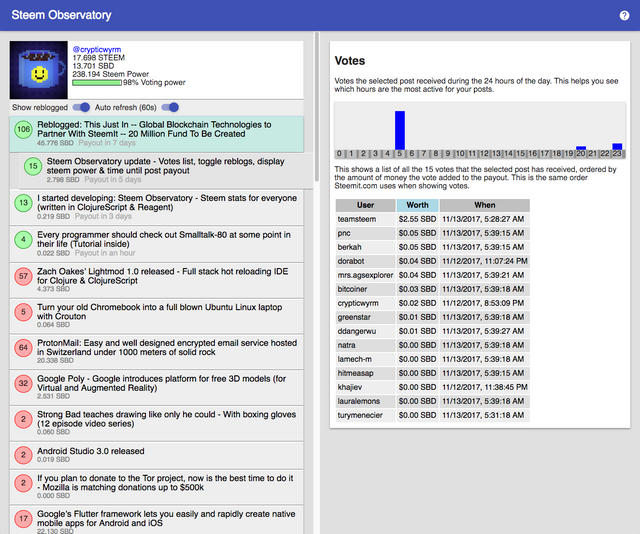
The votes panel (click on the number of votes to open it, the big circle in front of posts) now also shows a bar graph of votes your selected post received during the 24 hours of the day. This could help you figure out at what times your posts get the most votes, maybe even help you figure out a good time to post to make the biggest impact.

Material Design
The site looks a bit different now (hopefully better!), I’ve added a few of Google’s Material Design components and the Roboto font. This should in theory also make it easier to make the site work well on mobile (at some point in the future, haven’t worked on that yet).
Together with the new design comes a little help button in the top right corner, clicking on that brings you to the #steemobservatory hashtag on Steemit, where I post all articles about Steem Observatory like this update announcement.
So whenever you see something new you don’t fully understand, just click that info button to check out the latest update post where I explain it in detail.
Technical details for the programmers here
Finding a charting library that works well with ClojureScript and Reagent was too much trouble, so for the bar graph I just quickly wrote my own using just CSS & Flexbox. I will probably want to add more graphs later on, line charts and things like that, so at some point I’ll have to spend the time needed to find a good library since it doesn’t make sense to reinvent the wheel here.
To make the auto-refresh work everywhere (especially in the votes panel) I had to rewrite my code a bit. I already had to do that last update to keep the hot reloading functionality of ClojureScript & Figwheel working. So you definitely have to program code in a specific way to get the most out of using Reagent for website development. All in all it’s not that much though you need to be aware of and you can quickly figure out what works and what doesn’t. I’m pretty sure it quickly becomes second nature when you’ve programmed in this style for a while. And it’s absolutely worth it, still loving Reagent! :)