Image Processing - Visualisation
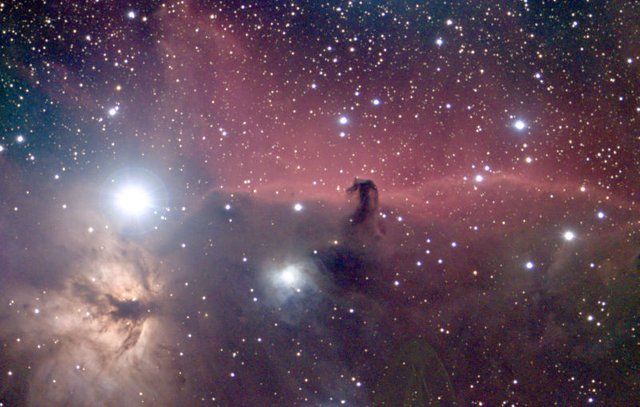
The Horsehead Nebula in Orion. Astronomical images have an enormous range of brightness, from the vanishing faint to bright stars, making it challenging to process to maximise the visible detail
In today's article, we look at the visualization of images, in particular adjusting brightness levels of an image to display all the visible detail. We look at the following topics:
- Image Stretch
- Histograms
- Non-Linear Stretch
- Histogram Stretching
Or the TLDR version : I've taken a photograph of the night sky and it's completely black and there is nothing there. How do I fix this!? Answer: Jump to section "Non-linear Stretch".
Image Stretch
Image Stretching is the process of adjusting the brightness and contrast of an image. Most people will be familiar with this when changing the brightness of a device screen. It is also analogous to turning the volume up or down on a speaker.
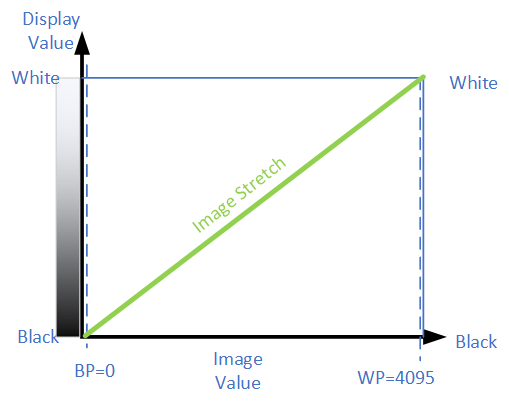
In a mathematical sense, the image pixel brightness values held in the computer's memory gets rescaled before being rendered on the screen. A simple linear image stretch can represent the green line in the following diagram. This line provides the mapping of image (in memory) values to displayed (on screen) values.
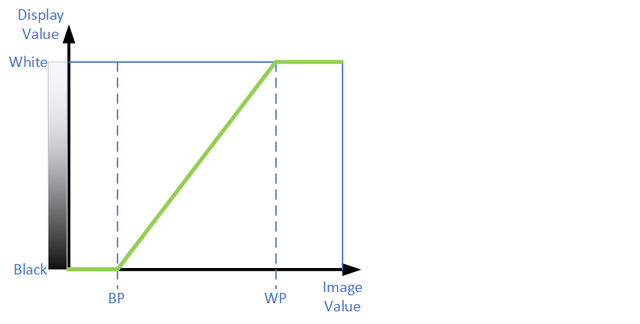
Stretch Diagram shows how the displayed pixel brightness maps to image pixel values
Here “BP” represents the black point or the pixel value which corresponds to black on the screen. Likewise, “WP” represents the white point or the pixel value which maps to white on the screen. Intermediate image pixels values between the black point and white point display as a grey level.
When the brightness is adjusted, the stretch diagram looks like the following. Note the black point, and white point is adjusted are shifted in unison as shown.
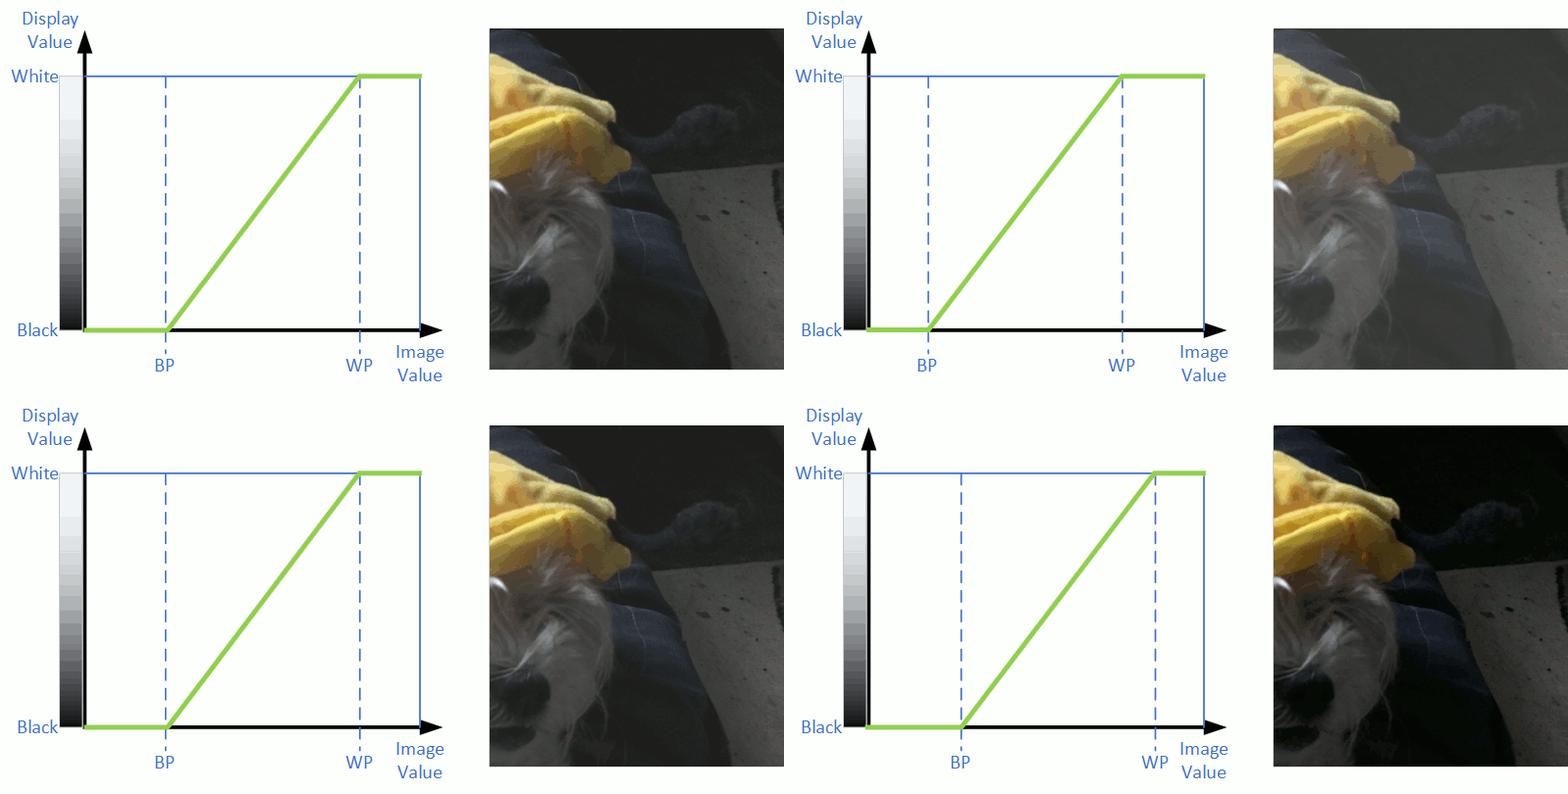
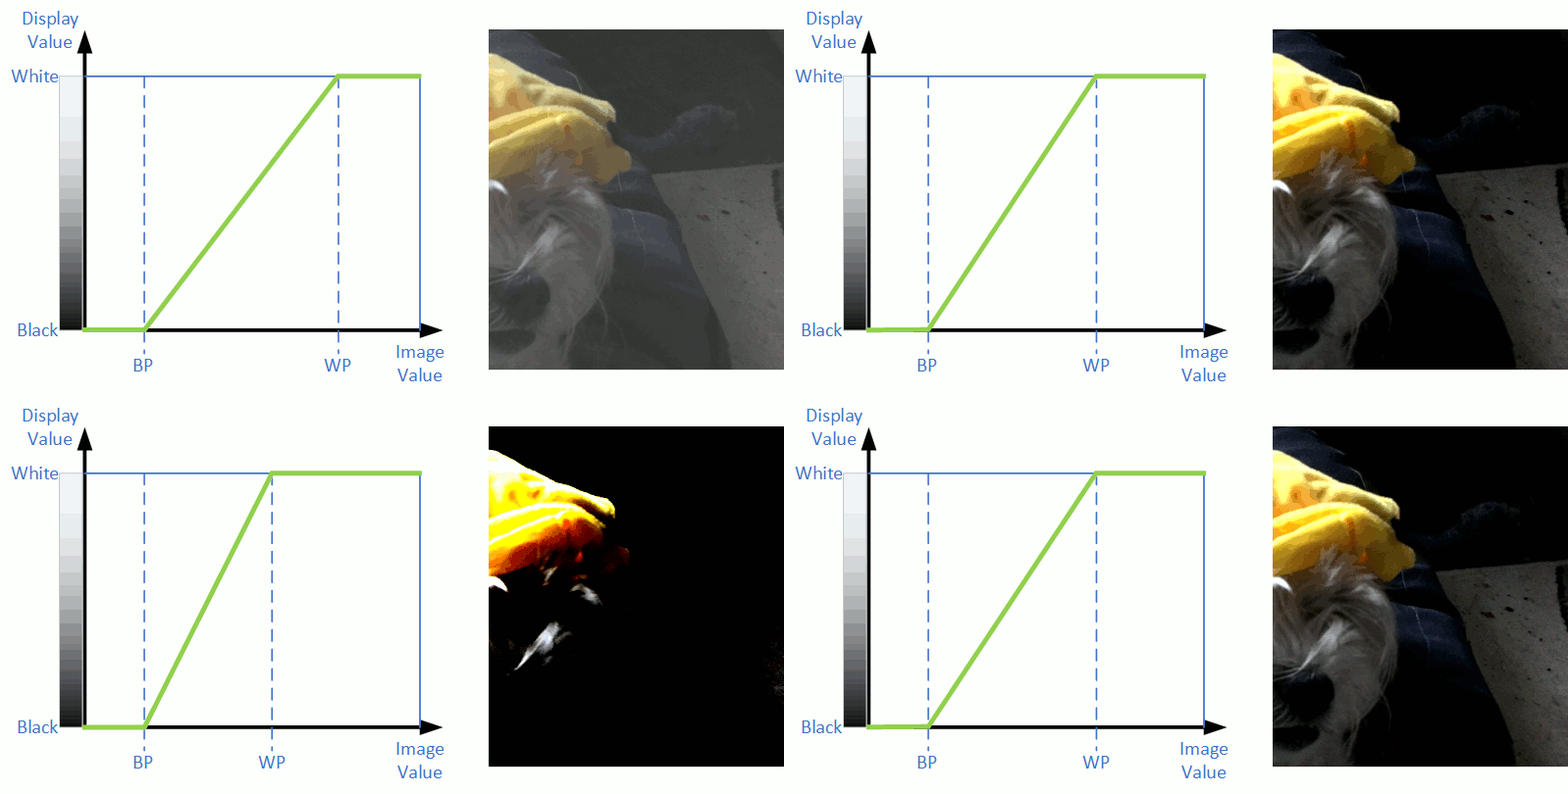
If contrast is adjusted, we see in the stretch diagram that Blackpoint and Whitepoint are moved closer or further apart. Contrast adjustment is demonstrated in the following diagram.
The histogram
A histogram of an image is a graph that displays the distribution of pixel brightness values in an image. It is a way of determining what proportion of an image is at a certain brightness. Many cameras have a histogram display in the viewfinder that enables correct estimation of exposure. Here is a typical image.
Daisy the Maltese "Bee-Dog"
Here is the histogram of that image.
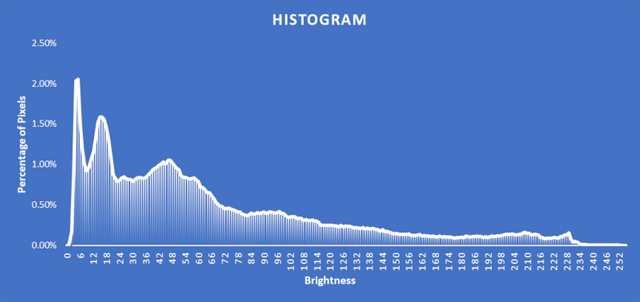
Histogram of Daisy the Maltese "Bee-Dog"
What does the histogram tell us in this image? First of all there about 253 (252 as well as the zero level) discrete brightness levels. This number of levels is typical of jpeg files which have brightness levels represented by 8-bit numbers that can represent a number from 0 to 255. However, what is significant is that most image has brightness values below above 70, judging by the peak in the histogram there. With no image, stretch applied this means that image is primarily dark, as 0 corresponds to black and 255 to white.
However, one other point to note is although the image is on the dark side, the histogram also tells us there are still significant numbers of brighter pixels from 70-228.
Histogram - Astronomical Images
Astronomical images tend to have very different histogram profiles when compared to daylight images. Let's look at the title image, converted to a 12-bit greyscale image (to simplify things). Here the image is stretched so the black point is at 0 and the white point is at 4095, which shows the entire brightness range of the image. It is almost entirely black apart from a handful of stars.
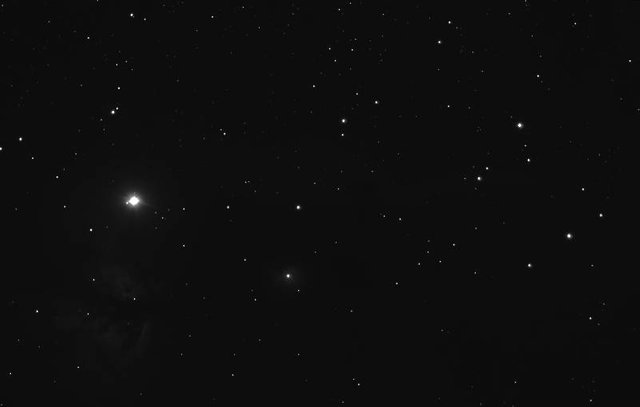
12-bit B/W converted version of title image. Without any image stretch the image looks almost completely black
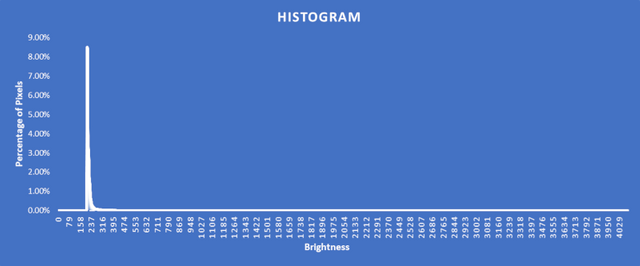
Looking at the histogram reveals that almost all the image pixels lay in a very narrow range of brightness values between 205 to 235. On the screen represents a very dark grey, almost black value which mean's the most of the image is black.
In the above image the stretch applied is blackpoint=0 and whitepoint=4095, represented as follows:
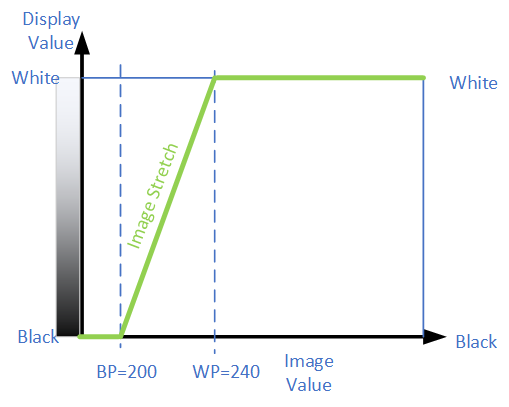
Since most of the pixel brightness values are between 205 and 235, let's choose a black point just under and a white point just over. A blackpoint=200 and whitepoint=240 is selected, so the stretch diagram looks like this:
The resultant displayed image looks like this. Quite an improvement and pretty much unrecognisable from the original image!
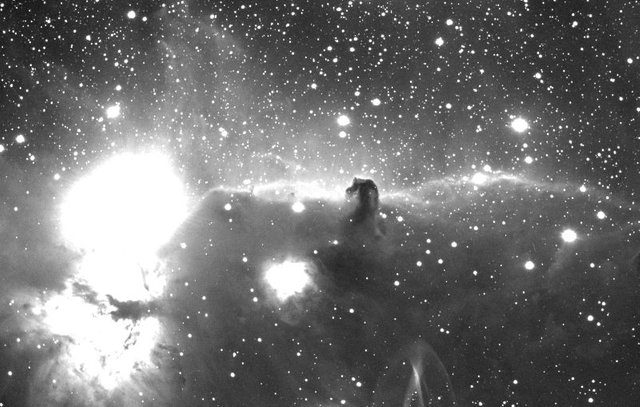
Above image displayed with an image stretch with blackpoint=200 and whitepoint=240. Considerable detail is now visible and it is amazing to think this is the same image. However, the brightest parts of the image are now over-exposed
What we have discovered is most the image detail is locked up in this very narrow part of the histogram. The image looks a lot better, but unfortunately, some of the areas are "blown out and overexposed". This flaw is addressable, and this is what we shall look at now.
Non-linear Stretch
With a non-linear image stretch, we use a curve instead of a straight-line to map the image pixel brightness to the displayed pixel brightness. In this case, we shall use a logarithm function to generate the curve with the black point set to 190 and the white point to 4095.
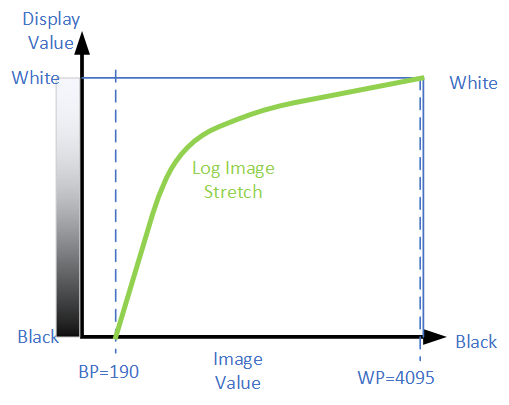
The resultant image is as follows. Notice that not only are the fainter areas displayed, but the highlights are also nicely visible. When you look at the curve above, notice that near the black point the green line is very steep which emulates the high contrast of the previous image, but the curve tapers off to prevent brighter parts from becoming too white. Human vision also has a logarithmic response which is why the image appears more natural.
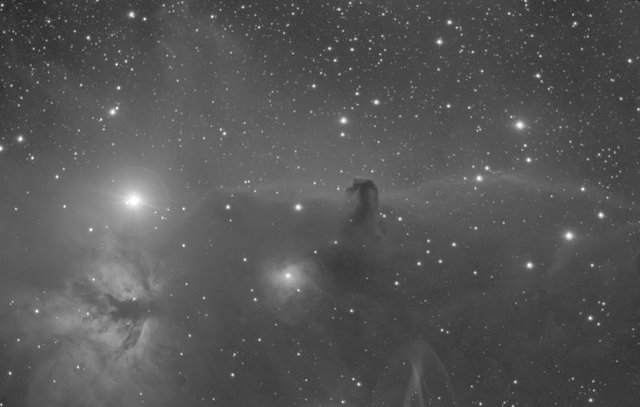
A logarithm stretch with blackpoint=200 and whitepoint=4095. Not only is considerable detail in the fainter areas visible, but the brightest portions of the image are preserved
Note there are many other curves that can be used in place of logarithms like power functions (gamma) and many others.
Histogram Stretching methods
Another approach for preserving bright and dark detail is to use the image's histogram itself to rescale and stretch the pixel values. Many astronomical processing packages have this capability, and the easiest way to see the action is to look at the result, as well as the output histogram. The following image has been stretched, so it's histogram stretching with a target shape being Gaussian bell shape.
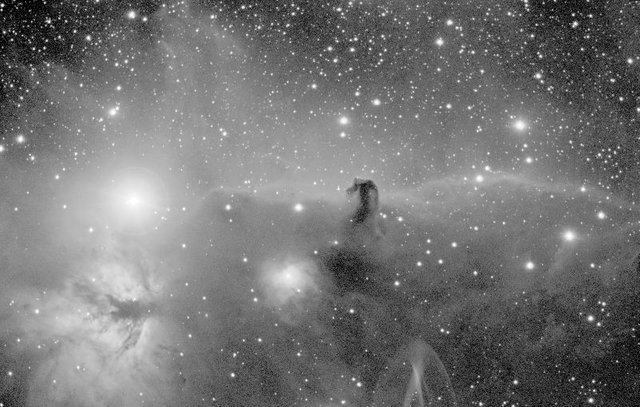
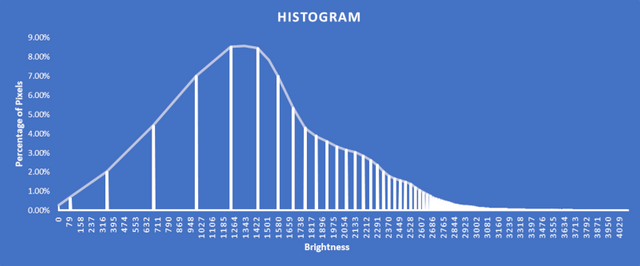
A Histogram stretch has been used with a target profile of a Gaussian peak. Compare this with some of the previous images
Here is the resulting histogram, compare this with the original narrow peak histogram from above.
Conclusions
This article was an introduction to image visualization for Astronomical imaging demonstrating the power of logarithm and Histogram stretching. In the next and final part, I shall complete the series by doing a review of suitable software for astronomical imaging, a lot of which is free.
Please note all images are the authors (unless otherwise noted)



Great post, thanks @terrylovejoy, as always very technical for my level, but very informative.
Downvoting a post can decrease pending rewards and make it less visible. Common reasons:
Submit
Thank you @bernardino, it's one of those subjects that seems pretty technically, but when you start doing astrophotography it starts falling into place.
Edit: I've added a TDLR guide :)
Downvoting a post can decrease pending rewards and make it less visible. Common reasons:
Submit
Hi @terrylovejoy!
Your post was upvoted by utopian.io in cooperation with steemstem - supporting knowledge, innovation and technological advancement on the Steem Blockchain.
Contribute to Open Source with utopian.io
Learn how to contribute on our website and join the new open source economy.
Want to chat? Join the Utopian Community on Discord https://discord.gg/h52nFrV
Downvoting a post can decrease pending rewards and make it less visible. Common reasons:
Submit
Your support is very much appreciated. Thank you!
Downvoting a post can decrease pending rewards and make it less visible. Common reasons:
Submit
Fantastic post, thanks for sharing, I have dabbled a little myself, but I want to take shots likes yours this summer :-)
Downvoting a post can decrease pending rewards and make it less visible. Common reasons:
Submit
Good job @boyerobert. I will keep my eye open if you decide to post your work.
Downvoting a post can decrease pending rewards and make it less visible. Common reasons:
Submit
I'm used to similar techniques in microscopy to increase dynamic range. It's neat to see how photography the very large and very small can be similar.
Downvoting a post can decrease pending rewards and make it less visible. Common reasons:
Submit
Sorry for the late reply @effofex. I do try to respond to everyone. The techniques are definitely useful to all branches of photography. Actually, even techniques used mostly for astronomy like stacking work extremely well in other areas (and HDR can be thought of as a stacking technique).
Downvoting a post can decrease pending rewards and make it less visible. Common reasons:
Submit
No worries, I can take some time to reply too, sometimes.
I absolutely use stacking, but more for noise reduction than enhanced dynamic range.
Downvoting a post can decrease pending rewards and make it less visible. Common reasons:
Submit
Great article Terry :-)
Which software do you use for image processing?
Downvoting a post can decrease pending rewards and make it less visible. Common reasons:
Submit
Maxim DL mostly, then into Gimp for final work.
Downvoting a post can decrease pending rewards and make it less visible. Common reasons:
Submit
Thank you Terry
Downvoting a post can decrease pending rewards and make it less visible. Common reasons:
Submit
Hi @ terrylovejoy! The article is quite educative and worth something very extrordinary which I will love to keep it in my library to read it more times! I loved the image of Horsehead Nebula you put it above.. :)
Downvoting a post can decrease pending rewards and make it less visible. Common reasons:
Submit
Thank you @star-vc I like the horsehead nebula and flame nebula. Although people are disappointed when they discover that it's almost impossible to see it through a telescope with your own eyes (I have seen in only once from a very high dark location decades ago when my vision was better than it is now).
Downvoting a post can decrease pending rewards and make it less visible. Common reasons:
Submit
Hello @terrylovejoy
I am enthralled at how you are able to break this down to the level that even a layman will understand the concept. So this is how astronomers view and see those space bodies? Very interesting piece.
Kudos to you.
Regards
@eurogee of @euronation community
Downvoting a post can decrease pending rewards and make it less visible. Common reasons:
Submit
Thank you @eurogee. I tried to make it as understandable as possible...will also start doing a TLDR's in the future to allow people to skip to the most important bits :)
Downvoting a post can decrease pending rewards and make it less visible. Common reasons:
Submit
That will be great. ✌️
Downvoting a post can decrease pending rewards and make it less visible. Common reasons:
Submit
Great work @terrylovejoy.
Thanks for the technical information regarding image stretching. By the way I just love those GIFs of yours, I think they are making your blogs even more attractive.
Looking forward to the review of free software!
Take care!
Downvoting a post can decrease pending rewards and make it less visible. Common reasons:
Submit
Hopefully, have that done in a week or 2. Thanks for stopping by @lordneroo!
Downvoting a post can decrease pending rewards and make it less visible. Common reasons:
Submit
Looking forward to! Always a pleasure reading your work! See you around :)
Downvoting a post can decrease pending rewards and make it less visible. Common reasons:
Submit
Here! You admitted you are using Photoshop for CGI images. Just as NASA!
:D
Downvoting a post can decrease pending rewards and make it less visible. Common reasons:
Submit
lol @alexs1320..I will take that as a compliment!
Downvoting a post can decrease pending rewards and make it less visible. Common reasons:
Submit
Your series has been very inspirational and motivational for everyone, including me. Especially your tutorial on how to take photos of astrophysical bodies by a smartphone, was very useful for me. Thank you for your contribution to spread knowledge.
Downvoting a post can decrease pending rewards and make it less visible. Common reasons:
Submit
Thank you @akdx , I am glad you enjoyed those articles!
Downvoting a post can decrease pending rewards and make it less visible. Common reasons:
Submit
Hello @terrylovejoy
I find this post highly informative, being a lover of astronomy, I sometimes wonder how these fascinating pictures are taken, and you've just presented me a portal on how it is done.
I look forward to the final part of the series on software to use.
Many thanks for an amazing post well written.
Downvoting a post can decrease pending rewards and make it less visible. Common reasons:
Submit
Thank you @agbona ! As I mentioned to @lordneroo I should have the other article done in about 2 weeks and then the series will be done...phew!
Downvoting a post can decrease pending rewards and make it less visible. Common reasons:
Submit
Will be looking forward to that!
Downvoting a post can decrease pending rewards and make it less visible. Common reasons:
Submit
Trying to figure out how to translate this into actual edits on Lightroom... maybe this is just meant for Photoshop type work. In any case I'm not entirely certain how to understand the post... BUT I loved it! Very interesting.
Downvoting a post can decrease pending rewards and make it less visible. Common reasons:
Submit
Hi @jarvie I actually use a program called Maxim DL to do this processing. But generally you won't get this sort of functionality until you get to Photoshop. You can definitely, do this type of work with Gimp, in fact the latest version 2.10 finally has good support for 16bit images. In Adobe Photoshop (or Gimp) the easiest way to get this result is using the histogram equalisation function.
Downvoting a post can decrease pending rewards and make it less visible. Common reasons:
Submit
Pretty awesome ... I'll have to find some sort of Youtube video of someone doing it live. Mostly i'm just intrigued that you're able to pull that much out of the black area and that you have it pinpointed down to such a range where most of that info is living.
Downvoting a post can decrease pending rewards and make it less visible. Common reasons:
Submit
Yes reading the histogram is a good starting point. Many astronomical software packages work differently in that they are designed to image stretch around the histogram peak.
Downvoting a post can decrease pending rewards and make it less visible. Common reasons:
Submit
Absolutely incredible, a wonderful piece of work that is further amplified by the use of proper Illustrative work. Keep up bud! :)
Downvoting a post can decrease pending rewards and make it less visible. Common reasons:
Submit
Thank you for your kind words @akeelsingh!
Downvoting a post can decrease pending rewards and make it less visible. Common reasons:
Submit
..although my knowledge is somewhat limited; but I grabbed something from this informative post.
Downvoting a post can decrease pending rewards and make it less visible. Common reasons:
Submit
Thank you @traviz, I'm glad you got something out of this :)
Downvoting a post can decrease pending rewards and make it less visible. Common reasons:
Submit
Comment withdrawn
I have learnt from the replies
Downvoting a post can decrease pending rewards and make it less visible. Common reasons:
Submit
Sorry. May I ask what has a microscope to do w.r.t this post? This is about telescope images, right? And he is not talking about microstructures either!
Downvoting a post can decrease pending rewards and make it less visible. Common reasons:
Submit
It's not microscope literally
It's a microstructure scanner and see as little as possible... Probably it is not applicable on this aspect
Downvoting a post can decrease pending rewards and make it less visible. Common reasons:
Submit
Hi @osariemen your message didn't make sense to me.
Downvoting a post can decrease pending rewards and make it less visible. Common reasons:
Submit
Sorry about that
Not my field was asking of something related to my field can do thesame Job..... U just made me look stupid
Downvoting a post can decrease pending rewards and make it less visible. Common reasons:
Submit
That was not the intent, I was genuinely trying to understand your point.
Downvoting a post can decrease pending rewards and make it less visible. Common reasons:
Submit
Learn some new from your post. Love to read it.
Downvoting a post can decrease pending rewards and make it less visible. Common reasons:
Submit
AMazing the least to say about it
Downvoting a post can decrease pending rewards and make it less visible. Common reasons:
Submit