
When there is a battle between the stock market and bonds and that war gets ugly, bonds usually win, and momo market players tend to have their legs whacked off when they thought utopia honey was just over the horizon. Almost every day, an article about rising interest rate doom appears. The most entertaining time is when financial pundits claim that the markets are plunging because of higher interest rates and rates actually declined during that particular time frame and a plethora of other possible triggers are ignored that coincide and encourage risk-off behavior. Case in point is news timestamps with the Khashoggi Saudi hack job that began in early October and correlate with plunges within the current market rollover. It appears that whenever volatility creeps back into the financial markets of late, interest rates get the blame out of the gate.
Trump the Jacksonian Has the Authority to Fire a Fed Chair – TraderStef, Oct. 19
Trump Steps Up Attacks on Fed Chairman Jerome Powell… “Intentionally sending a direct message to Mr. Powell that he wants lower interest rates.” – MorningStar, Oct. 23
What about inflation or GDP? The contrarian possibilities are endless.
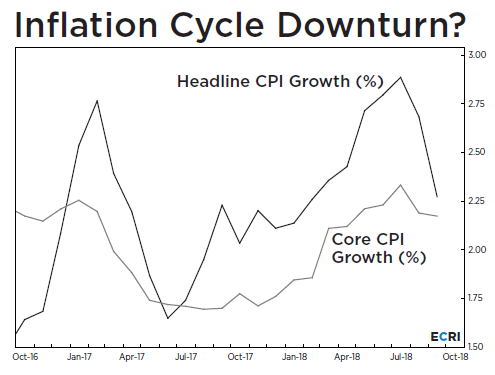
Taking a Break, or Rolling Over?… “Inflation pressures continue to simmer but, looking ahead, there is a hint of cooling.” – Economic Cycle Research Institute (ECRI), Oct. 19
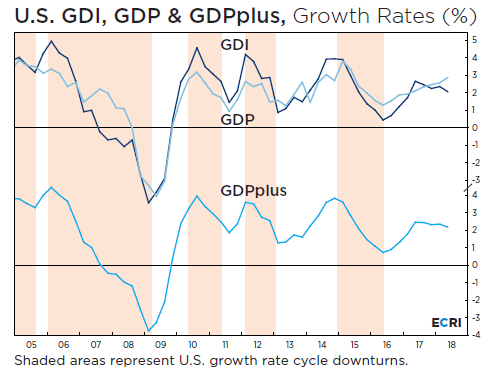
Damned Lies and Statistics… “Today’s GDP data is also likely to be exaggerating the economy’s strength. Indeed, since GDP tends to be substantially revised years after the fact, it’s useful to cross-check it with the data on Gross Domestic Income (GDI), an equivalent measure of output growth, based on income rather than purchases. Importantly, one study showed that initial GDP growth estimates tend to get revised toward initial GDI growth estimates, but not vice versa. So it’s surely worth noting that, in the second quarter of 2018, GDI grew at a scant 1.6% pace, far below the 4.2% GDP growth rate. Indeed, while year-over year (yoy) real GDP growth has been rising steadily, and has climbed to a three-year high (upper panel, light blue line in chart), yoy real GDI growth has been in a yearlong slowing trend, declining to a 1¼-year low (dark blue line).” – Mauldin Economics via ECRI, Oct. 23
Before I get lost in a myriad of miscellaneous chart data, let us focus on the Treasury market because according to the herd, when a magic number appears on a bond chart, that bull market is supposedly dead. Even Jamie Dimon at JPMorgan jumped in the bond bear camp this month because he sees 4% interest rates sooner, rather than later because the government must fund its deficits at all costs and the Fed will hold off on the rate hike brakes in the near-term out of the fear of looking like it is kowtowing to the POTUS.
If a majority of folks believe that something is so and the financial network wizards parade experts across your digital windows to the world, it is always wise to evaluate the other side of the curtain before attaching yourself to their conclusions, especially if you are an investor with a longer-term view, rather than suffering from short-term FOMO disease.
Without having to speculate, it is a good bet that U.S. economic growth is approaching a peak, as we are late in the business cycle where economic growth and inflation tend to decelerate. Long-term interest rates will move downward, but short-term rates may have a bit further to climb while the Fed continues on its war path toward a so called normalization, and the expectation is for the yield curve to possibly invert sometime during the first half of 2019 and indicate a recession is dead ahead. At that point, all bets may be off and the Fed will capitulate to the TaperCaper and apply those interest rate brakes.
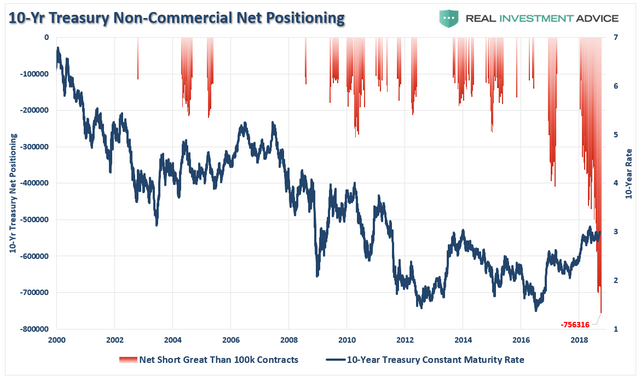
The Bull Market in Bonds Still Has Legs… “The key is to spot the inflection points in each bear move and buy the bonds in time to reap huge gains in the next rally. That is where the market is now, at an inflection point… The 10-year U.S. Treasury note is at the most extreme short position in markets today. It is even shorter than gold and soybeans… It takes a brave investor to go long when the rest of the market is so heavily short.” – Jim Rickards at The Daily Reckoning, Oct. 9
The Upcoming Bond Bull Market… “With bond traders more short than at any point in history, the ultimate ‘reversion to the mean’ in Treasury’s will drive rates towards zero. The chart below strips out all periods EXCEPT where net-short bond positions exceeded 100,000 contracts. In every case, interest rates turned lower.” – Real Investment Advice, Oct. 11
Over a year ago, Lacy Hunt laid out his reasoning of why the bull market in bonds is not over, and the data he referenced has trended in the direction indicated. The interview is a must-listen for savvies.
Video embed. Click here to watch on youtube.com.
Here are a few recent articles that validate several points covered during the interview, as well as his most recent newsletter.
Hoisington Investment Management Newsletter… “The U.S. economy appears to be on a steadily declining path to recession and disinflation/deflation. This may seem improbable in the face of record year-over-year growth in nominal GDP over the past decade (Chart 1). Additionally, the U.S. has experienced record stock prices, record confidence levels, a steady upward march of coincident economic indicators and the lowest unemployment rate (3.7%) reported in the past 49 years. These statistical measures, along with many others, however, carry no weight regarding future economic activity. Monetary policy has played a major role in determining recessions. But, unlike the past, the government’s debt level has reached such extreme heights that, like monetary policy, it is also serving to restrain economic growth going forward. An analysis of these factors leads to the inescapable conclusion that a bumpy landing is in store for the U.S. economy… The response by policy makers to this eventuality is a guess, but a higher interest rate policy does not appear to be an option. From the standpoint of an investment firm that started in 1980, when 30-year bond yields were close to 15%, the current 30-year treasury rate at 3% seems ridiculously low. In the near future, at 1.5%, the 3% yield will seem generous.” – Lacy Hunt, 3Q18 Review & Outlook
Lacy Hunt: Bond Bull Market Will Endure As Debt Strangles Growth – ZeroHedge, May 28
AutoSales Plunge Amid First Cut in Discounts Since 2013… “An incentive pullback is rare for this time of year. I don’t ever remember a de-escalation from June to July- so many off-lease vehicles coming back to market cheaper than new cars.” Industry Week, Aug. 1
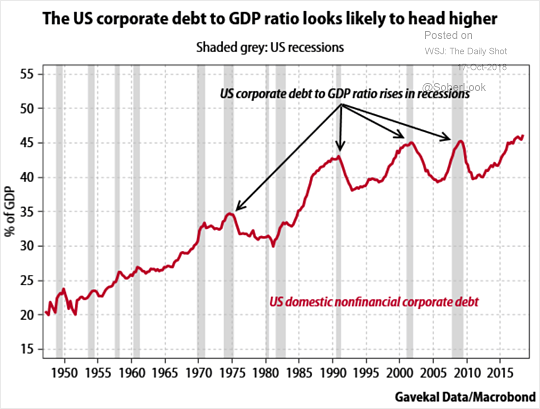
Who is the bogeyman this time? There are zombies out there… “As warnings about corporate debt grow louder, the market only grows more complacent.” – 13D Research, Sep. 27
Housing Market Is Raising Serious Red Flags – Bloomberg, Oct. 15
The Daily Shot: What Could Cause the Next Recession and When Is It Coming? – WSJ Daily Shot, Oct. 22
Former Fed Chairman Paul Volcker thinks ‘we’re in a hell of a mess’… “Volcker said there appears to be no ‘theoretical justification’ for its 2 percent inflation target. He said the Fed is just one of the institutions in which people have lost confidence.” – CNBC, Oct. 23
The Rolling Bear Market in U.S. Equities Is Getting Hard to Shake Off… “The issue is below the surface of the violent rotations going on daily among industries, demonstrated Monday when three sectors dropped by more than 1% while the full index slipped by half that.” – Bloomberg, Oct. 23
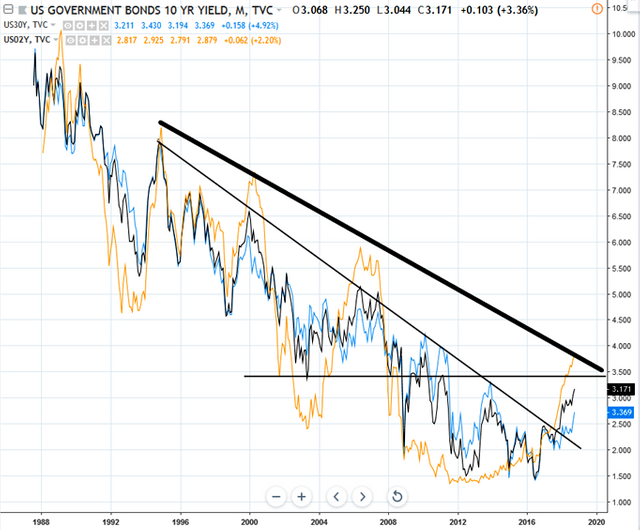
Here is a chart showing the 2-, 10-, and 30-year bond yields, along with nearer-term trendlines. A decisive break above 3.5% on the 10-year (black line) would raise a red flag for my personal portfolio.
Plan Your Trade, Trade Your Plan
TraderStef on Twitter
Website: https://traderstef.wordpress.com
Original Article Available HERE