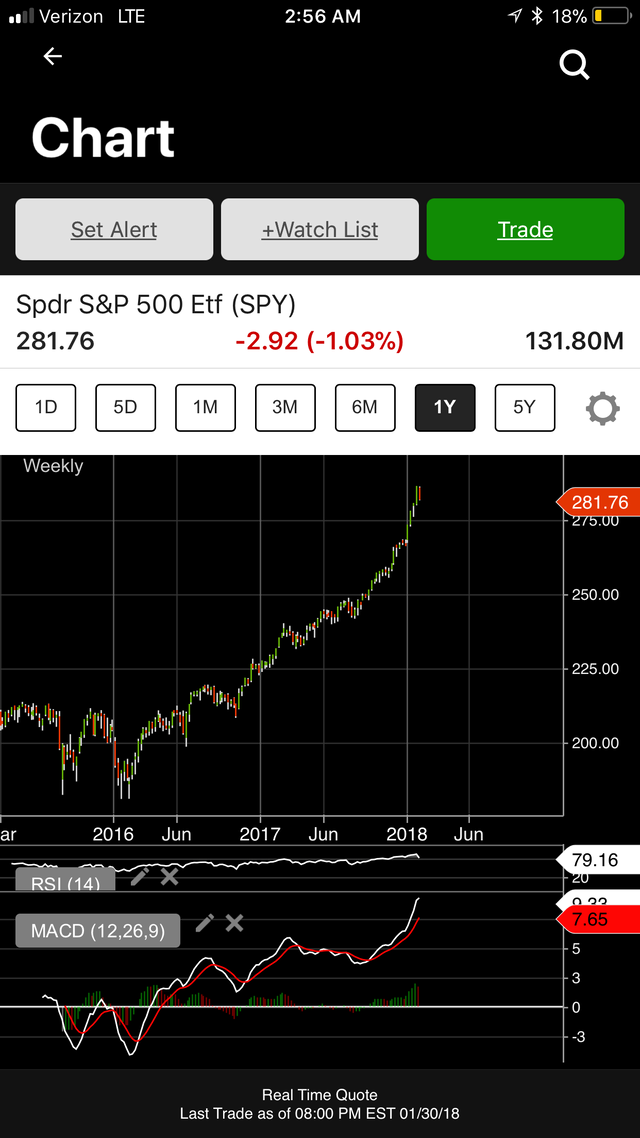
S&P 500 EXTENDED
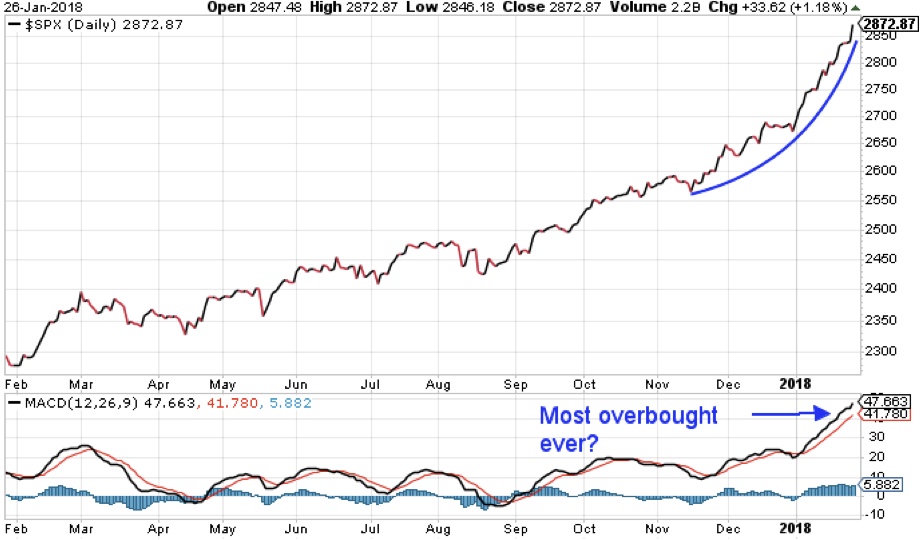
OVERBOUGHT!!!
Other charts same patterns and their solution!!
OUCH!!
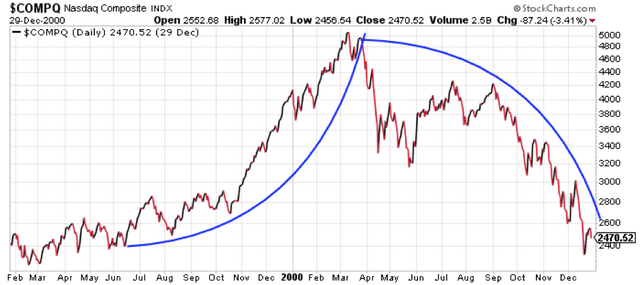
QQQ 2000
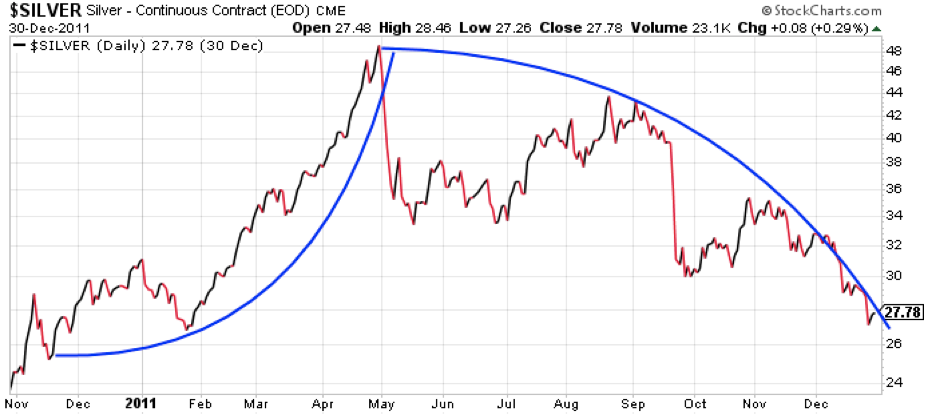
SILVER 2011
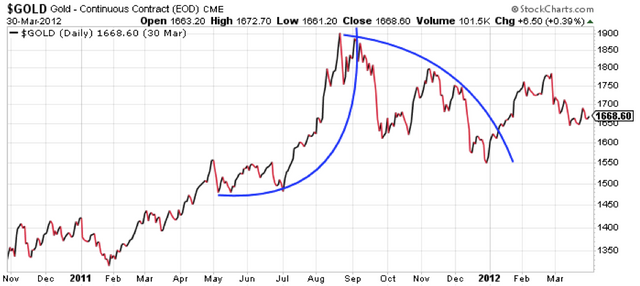
GOLD 2012
S&P ????
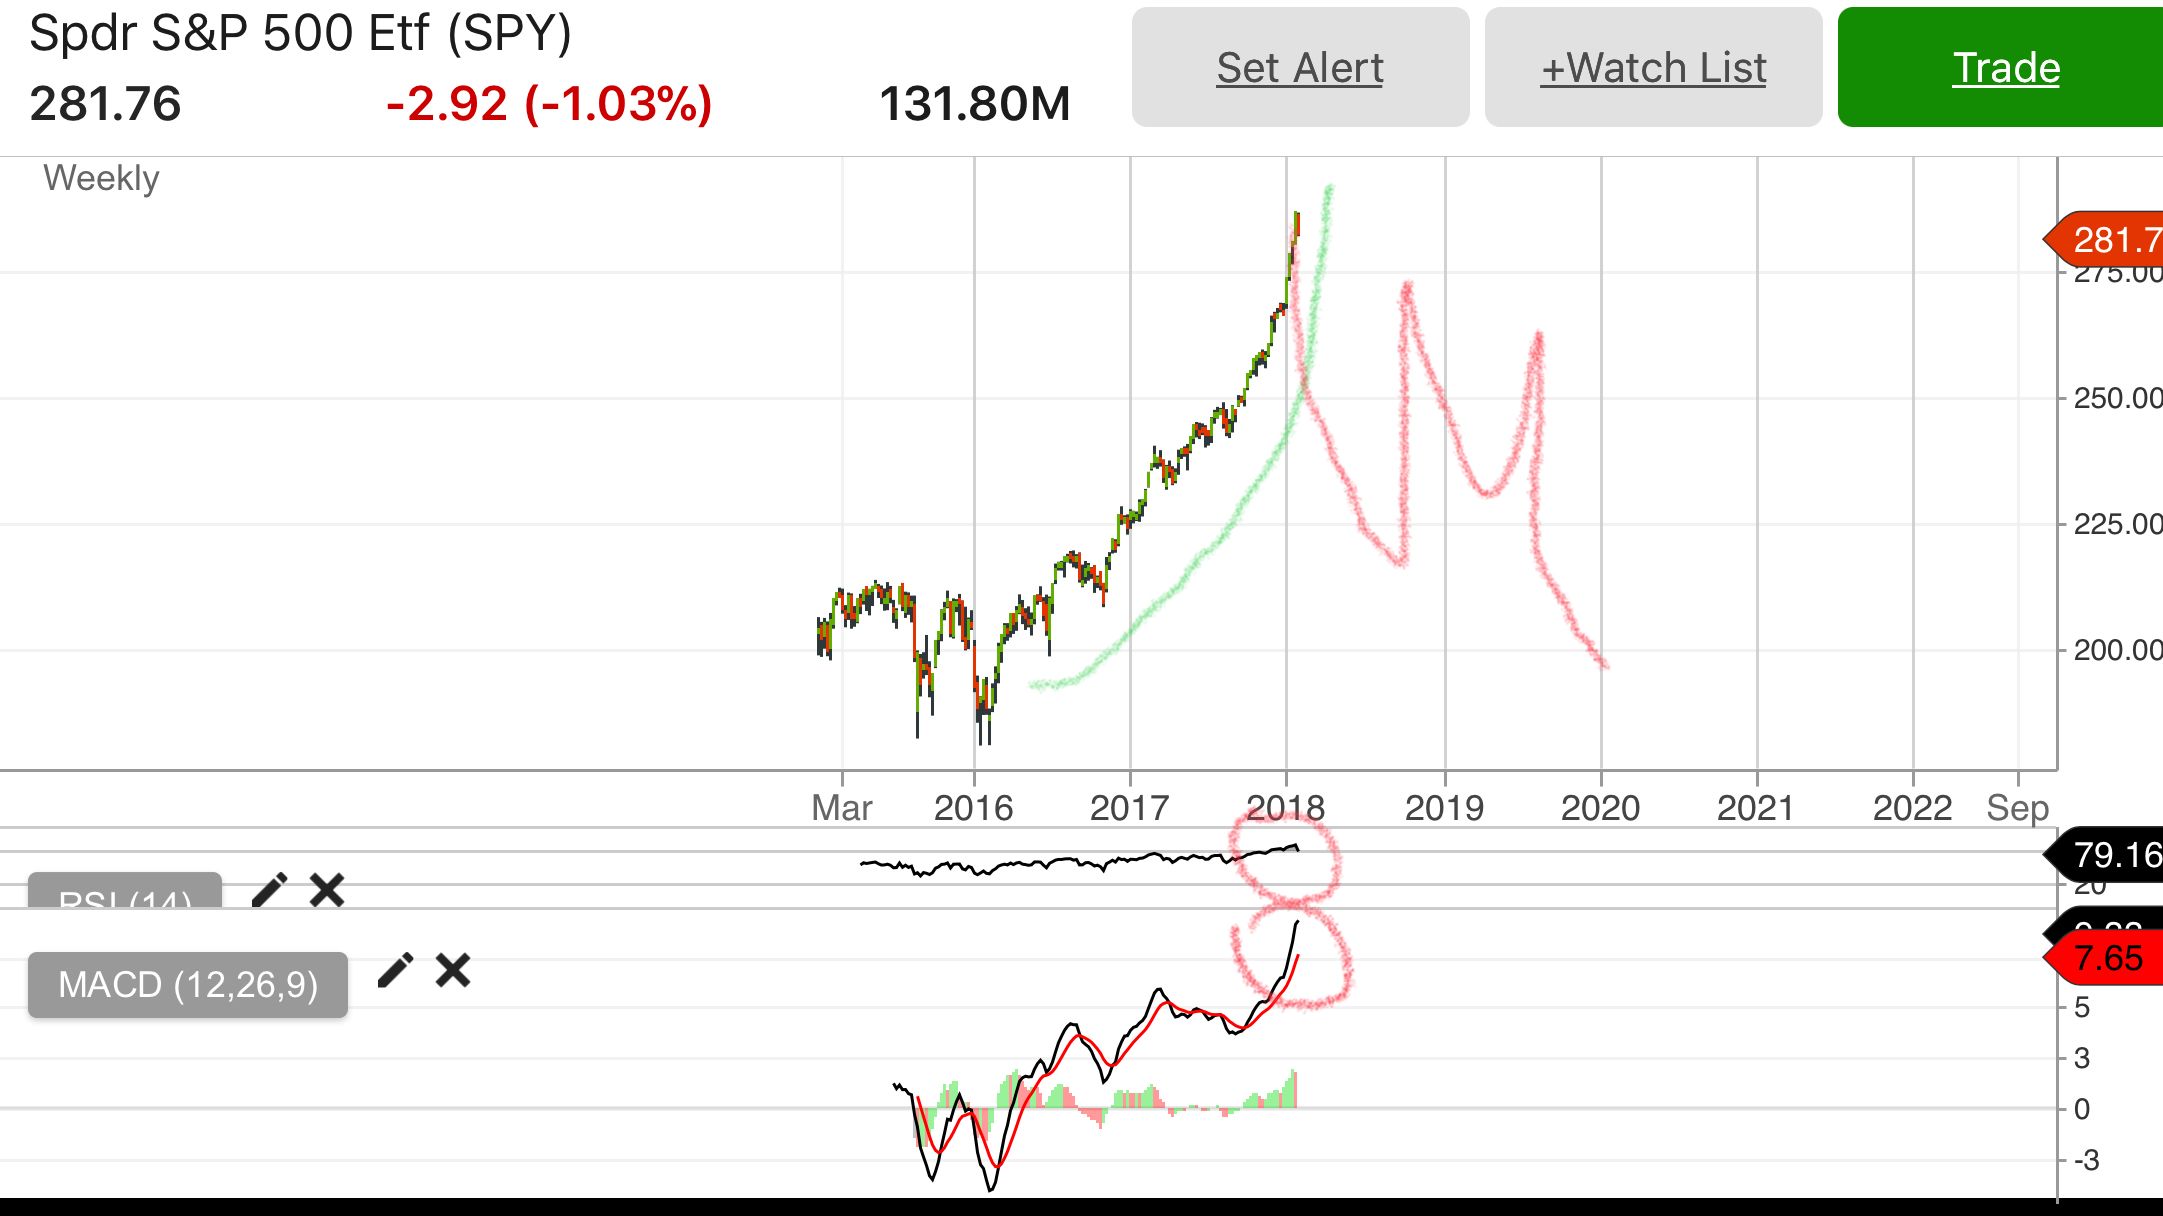
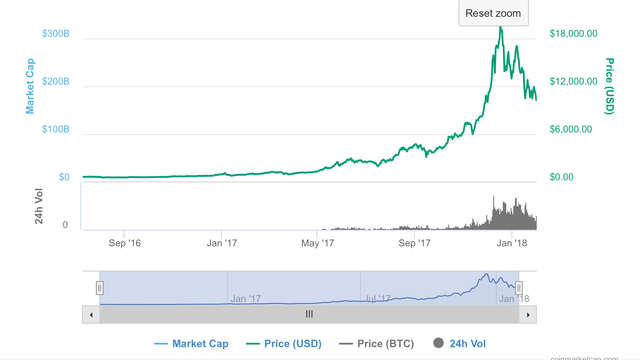
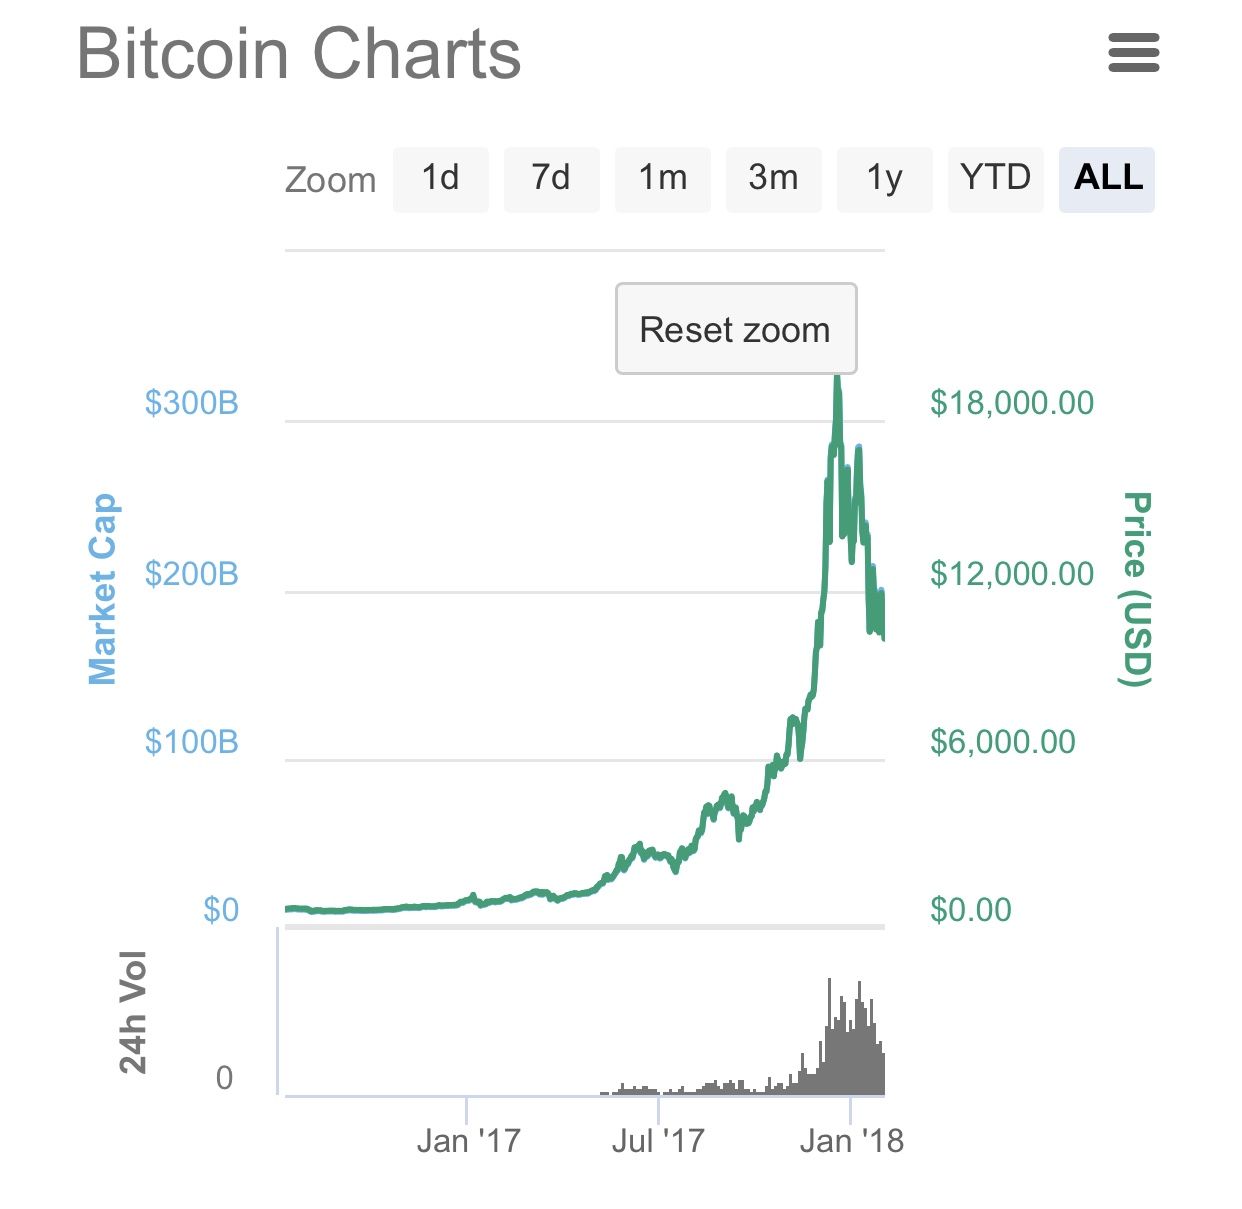
S & P follows BITCOIN!!?


S&P 500 EXTENDED

OVERBOUGHT!!!
Other charts same patterns and their solution!!
OUCH!!
QQQ 2000

SILVER 2011

GOLD 2012

S&P ????

S & P follows BITCOIN!!?
woow you actually did a very good analysis. I strongly agree with you. I look forward to the rising days. @ryan313
Downvoting a post can decrease pending rewards and make it less visible. Common reasons:
Submit
Excellent post and great graphic chart, thanks for sharing
Thanks @ryan313
Have a great day
Resteem
Downvoting a post can decrease pending rewards and make it less visible. Common reasons:
Submit
very good analysis. great post
Resteem
Downvoting a post can decrease pending rewards and make it less visible. Common reasons:
Submit
Excellent analysis. Thanks you very much
Downvoting a post can decrease pending rewards and make it less visible. Common reasons:
Submit
thanks for best information!
Downvoting a post can decrease pending rewards and make it less visible. Common reasons:
Submit
Great analysis! You are awesome @Ryan313 resteem and upvote
Downvoting a post can decrease pending rewards and make it less visible. Common reasons:
Submit