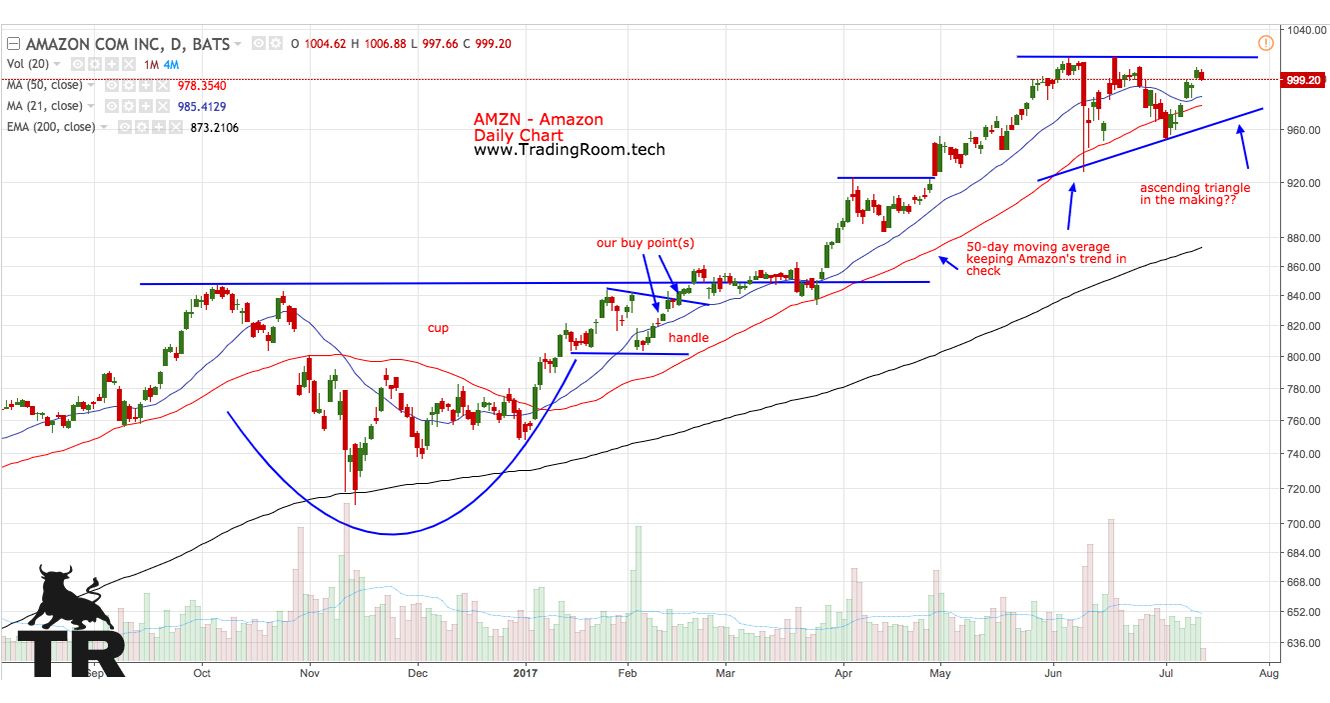
AMZN – Amazon Daily Chart. The retail/tech behemoth is back at 1000 and appears to be putting in an Ascending Triangle pattern. A close below that blue upward slanting trendline would negate this at around 956.
In the news we’ve read that Amazon Prime is set to take over cable subscriptions in the US as the main form of program content delivery.
Our original buys were at 818 and then again at 843 from the cup and handle breakout.
Here’s the chart for the tech innovating retailer:
see more on Trading Room: http://tradingroom.tech/2017/07/amzn-amazon-back-at-1000-new-ascending-triangle-pattern/