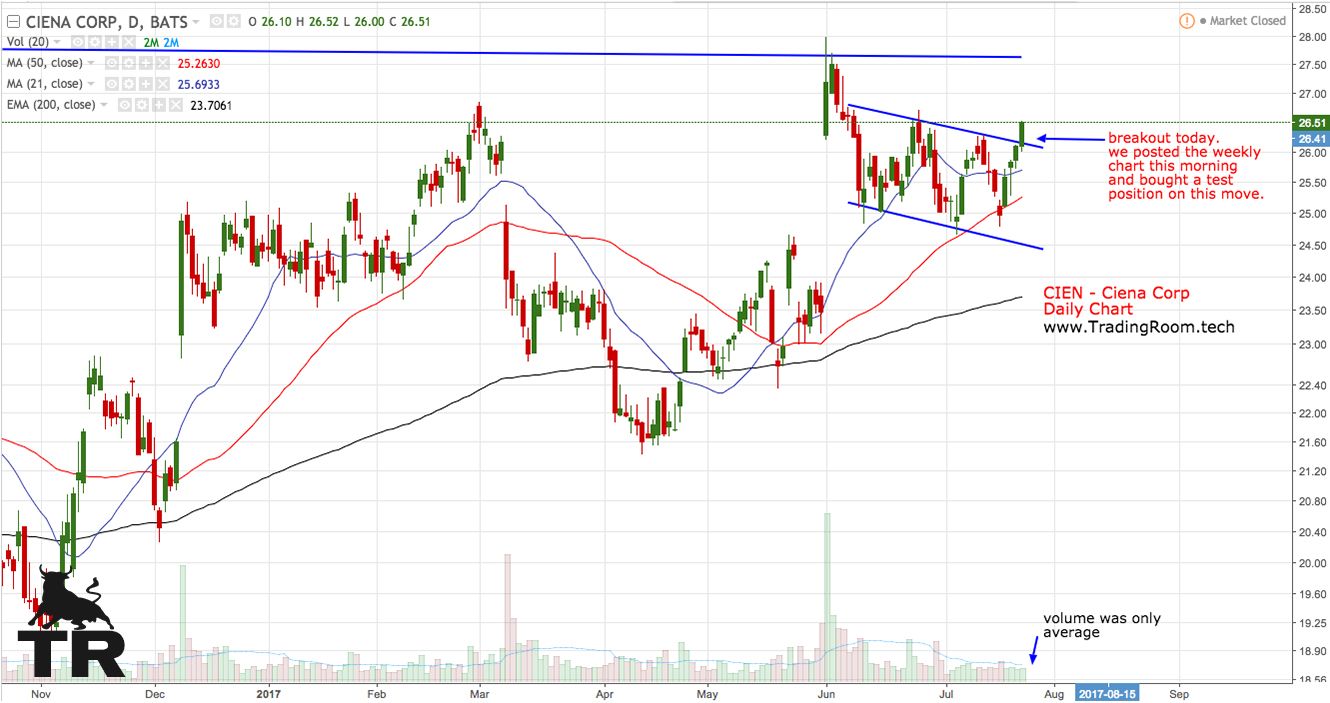
CIEN - Ciena Daily Chart - breakout today but resistance overhead. We posted the weekly chart this morning and bought a test position on this move.
Notes from this morning’s post:
Can this communications network equipment and solutions provider breakout of this long term base? Other fiber optic setups are also in the works right now.
There seems to be some volume accumulation signs in the base and earnings are due at the end of August - 8/30/2017
On a historical note, back in the year 2000 CIEN was trading at $896 a share.
