"Mad Money" host Jim Cramer warned investors about getting too cynical after a robust year for the averages.
Taking to the charts with the help of technician Bob Lang, Cramer reflected on the S&P 500 and the Dow Jones industrial averages' 2017 performance.
After an almost picture-perfect year, Cramer and Lang agreed that the two indexes still have room to run thanks to positive momentum trends.
blob:https://www.cnbc.com/f28fb0d8-de92-4767-93b5-b8373b425e13
Charts indicate a strong start to 2018 Charts indicate a strong start to 2018
14 Hours Ago | 01:06
In light of the new year, CNBC's Jim Cramer wanted to zoom in on two of the market's top benchmarks to see how they'll fare in 2018: the S&P 500 and the Dow Jones industrial average.
So the "Mad Money" host recruited technician Bob Lang, the founder of ExplosiveOptions.net and one of the three minds behind TheStreet.com's Trifecta Stocks newsletter, to get an analytical take on the action.
Cramer and Lang began with the weekly chart of the S&P. For the first time ever, the index did not have a single losing month in all of 2017, perhaps even more impressive than its nearly 20 percent annual gain.
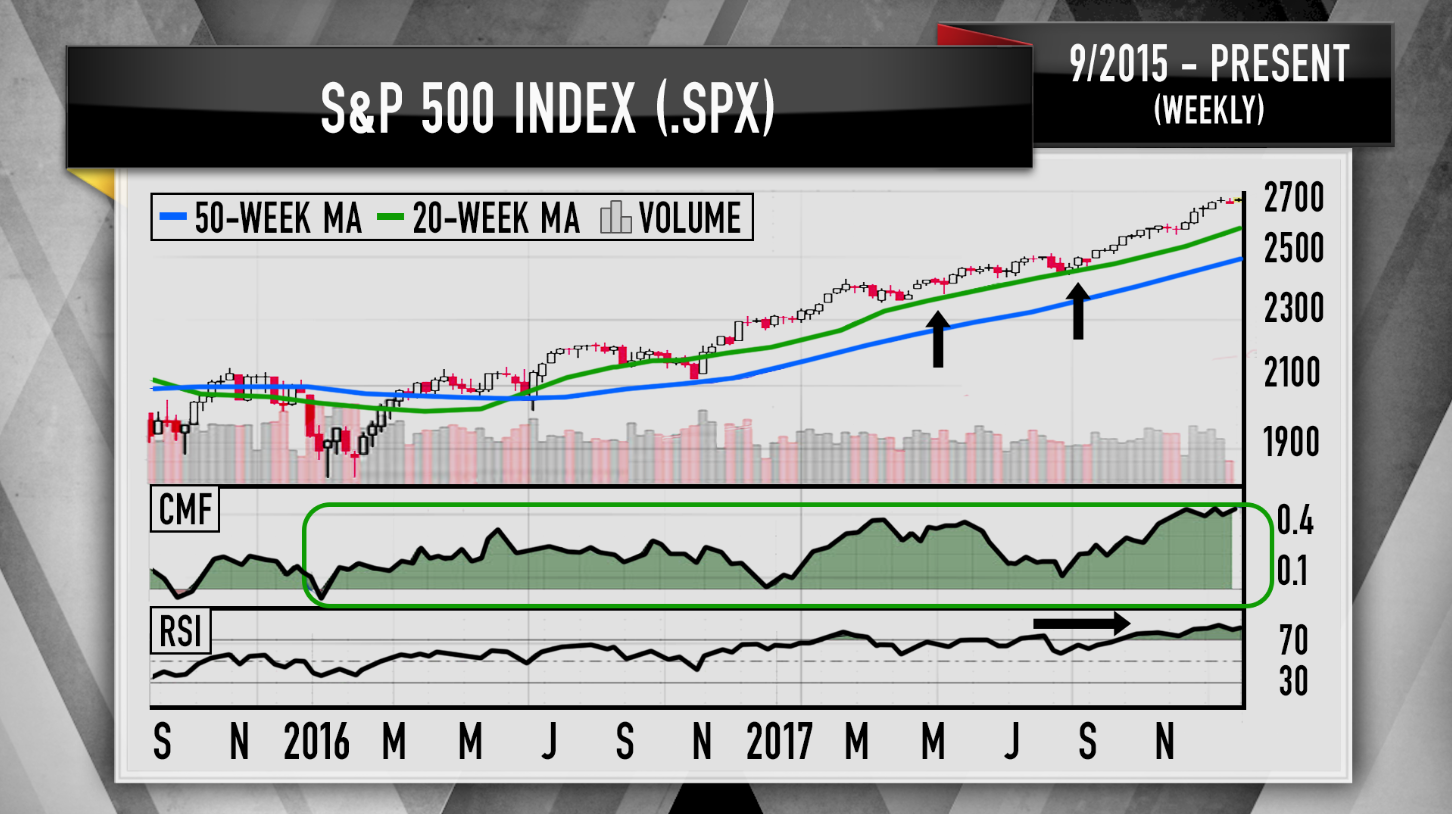
"With so much momentum coming into this year, Lang thinks it would be a big mistake to get too bearish on this one," Cramer said.
In the fourth quarter, more stocks in the S&P started to trade above their 50-day moving averages, a good indicator of the breadth and strength of the index's rally.
Cramer attributed the strength to institutional buying after the S&P's small dip in November, and said that the strategy was a winning one going forward as well.
"Until we see any evidence that these institutions want to start selling en masse, and we have none, Lang thinks you should keep buying the S&P into any dip if we get one," Cramer advised. "Last year, the S&P only had two pullbacks, and they both went to its 20-week moving average ... and both [of] these turned out to be excellent buying opportunities."
All in all, Lang wouldn't be surprised if the S&P logged yet another double-digit gain in the new year, he told Cramer.
What of the Dow industrials? First and foremost, Cramer noted the average's 25 percent gain for 2017, calling its weekly chart "picture-perfect."
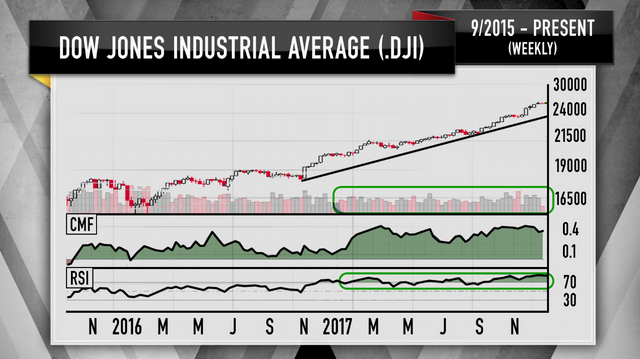
From the Chaikin money flow oscillator, which measures buying and selling pressure, to the Relative Strength Index, which measures momentum, the Dow's technical indicators were red-hot for most of 2017, indicating high levels of institutional buying.
"From a momentum perspective, Lang says this chart is a thing of beauty," Cramer said. "Volume trends are positive, the money flow remains very strong — what's not to like?"
Lang even said that trying to call a top for the Dow would be "pointless" given its strength and predicted a 12 to 15 percent rise in 2018, keeping the possibility of Dow 30,000 on the table.
"[These] charts give us a lot of reasons to be feeling pretty darned good about 2018," Cramer said. "No, we don't want to get too euphoric. No, we don't want to be complacent. But I also think it's a big mistake to get too cynical — that's right, too sardonic — for your own good. Irony never made a dime for anybody. Let's face it: we've got a phenomenal bull market going here. Why don't you just enjoy it?"
WATCH: A year of Dow and S&P 500 charts with Cramer
apner steem dollar ki bikroy korben
Downvoting a post can decrease pending rewards and make it less visible. Common reasons:
Submit
@originalworks
@steem-untalented
Downvoting a post can decrease pending rewards and make it less visible. Common reasons:
Submit
The @OriginalWorks bot has determined this post by @mahmud99 to be original material and upvoted it!
To call @OriginalWorks, simply reply to any post with @originalworks or !originalworks in your message!
Downvoting a post can decrease pending rewards and make it less visible. Common reasons:
Submit
Hi! I am a robot. I just upvoted you! I found similar content that readers might be interested in:
https://explosiveoptions.net/options-trading-charts/jim-cramer-bob-lang-go-off-charts-talking-markets-2018/
Downvoting a post can decrease pending rewards and make it less visible. Common reasons:
Submit