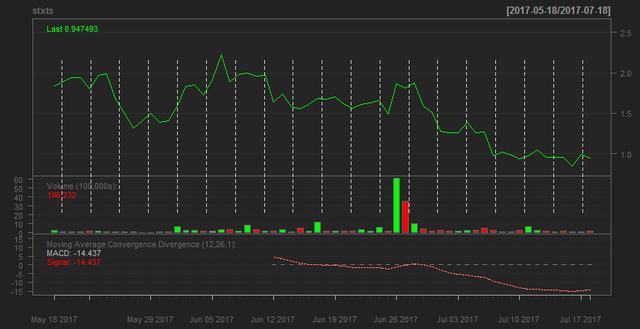
Many of us wonder how would the value of Steem currency evolve. There are plenty of tools used on the stock market in order to predict the price of currencies, however one should remember that there is no mathematical reason they should work properly, i.e. technical analysis does not provide us with any consistent nor unbiased estimators. Why sometimes technical analysis predicts the evolution of time series properly? Perhaps this is due to some sociological phaenomena, I don't know.
My first post contains script in R, which can help you start making your own technical analysis.
At the beginnning load some useful packages.
library(jsonlite)
library(data.table)
library(quantmod) # Quantitative Financial Modelling & Trading Framework for R
library(TTR) # Technical Trading Rules
library(XML)
library(RCurl)
library(rlist)
library(tidyquant) # Helps with cleaning the xts data
You have to make sure you use standard formatting. On the Steemit website dates are saved in non-standard formatting "Abbrevioated month day, year". If you use some other than English language you may have some other than "Jan Feb Mar Apr" etc. month abbreviations so the following line may be necessary.
Sys.setlocale("LC_TIME", "English")
You have to specify the time interval; note that at 17th May there were some perturbations on the stock.
theurl <- getURL("https://coinmarketcap.com/currencies/steem-dollars/historical-data/?start=20170518&end=20170719",.opts = list(ssl.verifypeer = FALSE) )
Now we have the data from the website - we have to clean it.
tables <- readHTMLTable(theurl)
tables <- list.clean(tables, fun = is.null, recursive = FALSE)
n.rows <- unlist(lapply(tables, function(t) dim(t)[1]))
steemdata<-tables[[which.max(n.rows)]] # getting only data about the currency
Data frame is the standard structure used in R. Before transfering the data into xts structure, we will continue cleaning the data on the data frame.
stdf <- data.frame(steemdata,stringsAsFactors = FALSE)
stdf[,1]<-as.Date(stdf[,1],"%h %d, %Y") # standard date format
stdf[,6]<-as.numeric(gsub(",", "", stdf[,6])) # getting rid of commas in number representation
stdf[,7]<-as.numeric(gsub(",", "", stdf[,7]))
stdf[is.na(stdf[,7]),7]<-0 # replacing N/A's with zeros

stxts<-as_xts(stdf, date_col = Date) # in xts files rows are numbered by the dates!
storage.mode(stxts) <- "numeric" # here is a tricky one!
Now you can perform technical analysis! For example:
chartSeries(stxts, type = "line", up.col = "green", dn.col="red", line.type="l",show.grid = TRUE)
addMACD(fast=12,slow=26,signal=1)
grid(nx=20, ny=1, lty=2, lwd=0.1)

I will try to explain this picture in my next post! Stay tuned! :)
Is better steem power than steem right?
Downvoting a post can decrease pending rewards and make it less visible. Common reasons:
Submit
I don't know yet
Downvoting a post can decrease pending rewards and make it less visible. Common reasons:
Submit