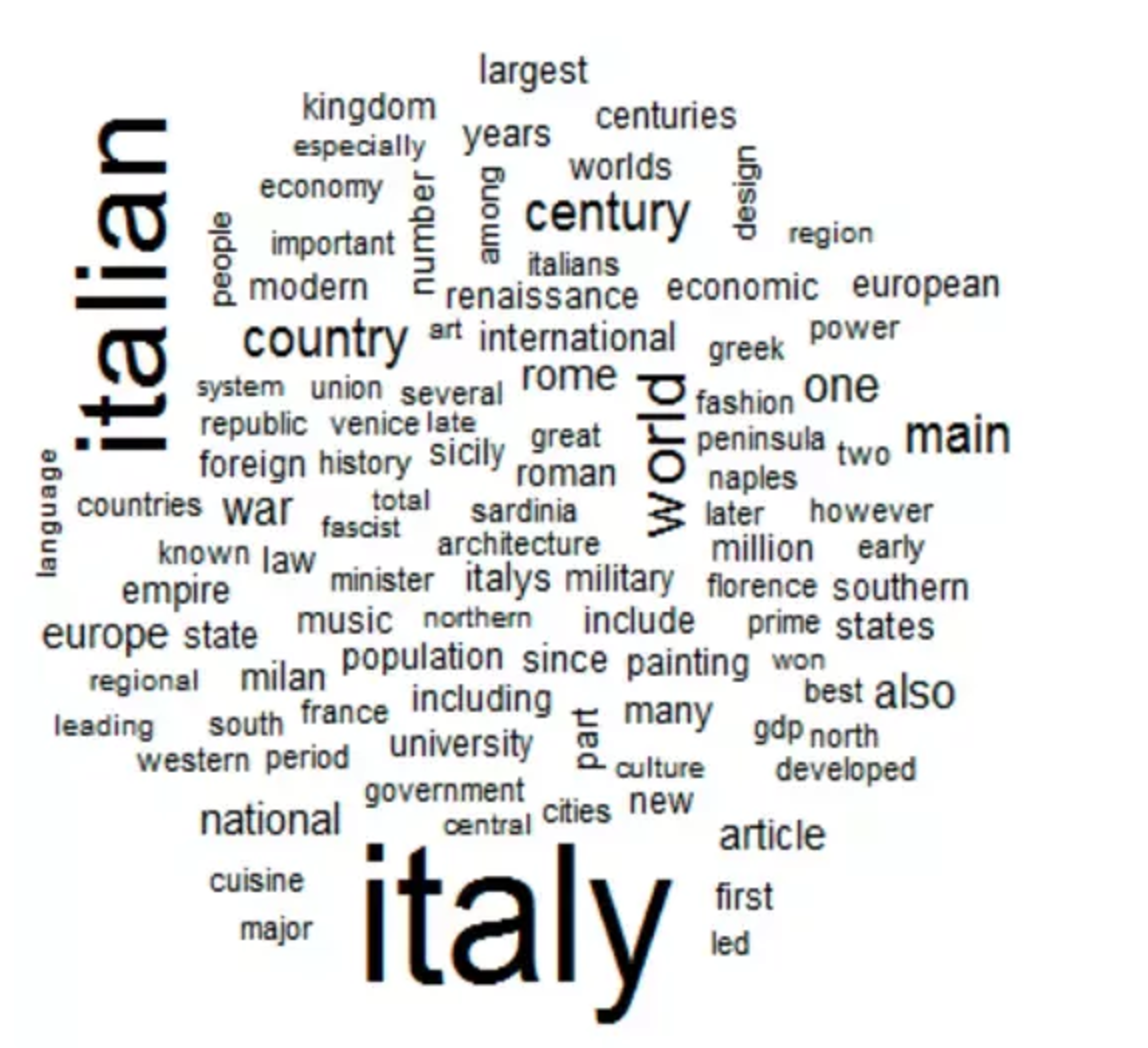
A simple way to find patterns in text data is to try and make a word cloud graphics or tag cloud graphics.
A tag cloud is representation of text data, which are used to depict keyword metadata of a piece of text. Tags are usually single words, and the importance of each tag is shown with font size or color. The bigger the font size and more relevant is the word (more times is repeated) inside the text.
This format is useful for quickly perceiving the most prominent terms and for having a quick idea of the content of the text. For example if you want to analyze the wikipedia page on Italy in R programming this is pretty easy to do . I converted this page in text and saved it in local.
You have to download and import in Rstudio the "tm" library and the "wordcloud" library. Then procede as follows :
read the text, line by line
page = readLines("italy.txt")
produce a corpus of the text
corpus = Corpus(VectorSource(page))
convert all of the text to lower case (standard practice for text)
corpus = tm_map(corpus, tolower)
remove any punctuation
corpus = tm_map(corpus, removePunctuation)
remove numbers
corpus = tm_map(corpus, removeNumbers)
remove the stop words
corpus = tm_map(corpus, removeWords, stopwords("english"))
create a term matrix
dtm = TermDocumentMatrix(corpus)
reconfigure the corpus as a text document
corpus = tm_map(corpus, PlainTextDocument)
dtm = TermDocumentMatrix(corpus)
convert the document matrix to a standard matrix
m = as.matrix(dtm)
sort the data with the highest as biggest
v = sort(rowSums(m), decreasing = TRUE)
finally produce the word cloud
wordcloud(names(v), v, min.freq = 10)
Finally you will see a graphics as the following :

For finding patterns in text data you can pay attention to the association of words for example you can check if word X compares together with word Y and so on.. If you visualize the data this way it becomes relatively easy to spot those associations. As an alternative for finding the associations you can use "arules" library of R .