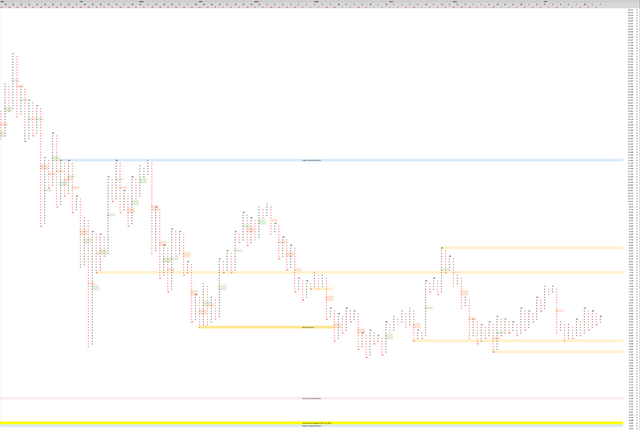
Point and Figure  It's been almost a month since I last posted one of these. I have been making good on my thoughts to not trade BTC until the descending triangle breaks (https://twitter.com/joyrider50/status/1031596366970028033). Last time we posted a PnF we were in the range between 6,000 and 7,400. Low and behold 3 weeks later and we are still in that range. We have had only 1 long pole in the last month (and it has been resolved). That is 1 out of the last 26 columns. Might be some sort of record since I started doing my PNF in 2016. This sort of sideways over long period is good for bulls because bitcoin is deflationary and time is on the bulls side.
Descending Triangle  Here's the descending triangle I've been watching for over a month. We are about 82% to the apex of the triangle, which means that when it breaks it is less likely for break out to 'fail', statistically. Lets look at the volume. Like all triangles, the volume is declining. The 20MA on daily volume hasn't been this low for over a year.
6400-6500 level is strong and good place to bulls to long with a loose trailing stop somewhere around break down of triangle. Bears should watch for break of linear trend & failure to make higher high. That would be a short at 7,200-7,429 with a tight stop.
@autemox, I gave you a vote!
If you follow me, I will also follow you in return!
Downvoting a post can decrease pending rewards and make it less visible. Common reasons:
Submit