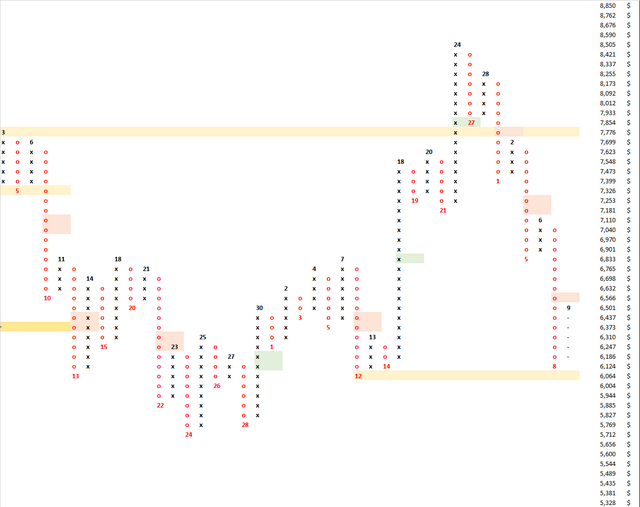
Point and Figure  We have no long poles going all the way back to October 2017. That is almost a year of consolidation. Well, not quite anymore, because yesterday's close brought a new long pole of 15 O's. Any price over 6,501 will resolve this pole. Our range is between 6,064-8,505. This is a pretty large range. We touched down at the bottom of the range without making a lower low yesterday.
Well last couple days I recommended buying anywhere at or below $6750 support and stop it out at lower low below the right shoulder on the old inverse head and shoulders. We stayed above that right shoulder just barely, and presented great entries for longs. Price action was more bearish than expected: Price came all the way down the range and almost made a lower low. Not exactly what a bull wants to see. So how will we decide if the longs should be abandoned or not? Not really any way to know, in my opinion, and it is important to hold to your plan unless there are fundamental changes. That means setting your stop near the lower low and hoping for the best.
But lets take a look at where resistance is:  Here we have a 2 hour chart, where you can see theres no signs of momentum decreasing. I've drawn a 5-point curve that shows us our downward trajectory, and that curve should break soon as it is irrational/unsustainable. If it breaks, resistance is between 6750 (throwback, horizontal level, 4 hour cloud)-6930 (23% fib, volume profile node). This is where worried bulls will drop their longs. If the curve doesn't break, you should take loss on long 0-1% below the lower low and not consider entering a new long until after we've broken the curve.