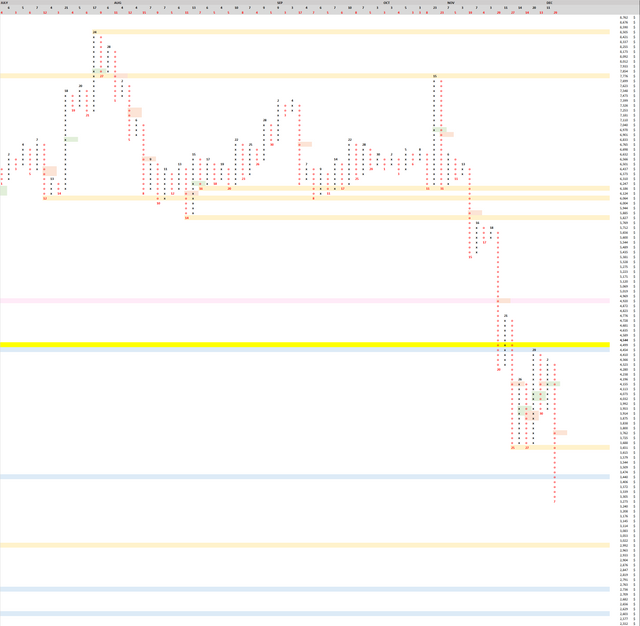
Point and Figure  We are in a long pole of 29 O's. In the last two years, out of 173 long poles, only 17 of them have been larger than 29 (16%). So this is a very long pole. Don't short such a long pole. 50% retrace of this pole would bring us above 3762. We have broken out of the 3651-4454 range. Arguably we are in a new range between 2992 - 4454, based on old horizontal level from between june-sep last year, but since it is based on old horizontal levels it isn't very reliable and I consider us to be in more of a downward price discovery.
New all time highs for total amount of bitfinex shorts.

Not exactly something you can trade off of but I will say I would never open a short when total shorts are at all time high. Too much risk!
Here are the recent long pole of O's, from the big wedge breaking down, which have not resolved 50%: 10/31/2018: 23 O's, resolves if price moves above $6,901. 11/15/2018: 19 O's, resolves if price moves above $5,885. 11/20/2018: 29 O's, resolves if price moves above $4,920. It could be a while before we see all 3 resolved, but I would be cautious shorting until at least the third is resolved with a price move above $4,920.
Last time I posted, we were watching a 6 hour bull div which had 3 hours before confirmation. That bull div did not confirm. Instead we moved lower and broke down out of our PNF range.
I believe the break down from large wedge has almost completed playing out. I created a speculative chart:

Our strategy would be to play the end of the break down of the large wedge using momentum. Since the wedge was on a 3 day timeframe, the plan is to watch for a 3 day bull div at support. This would signal the end of the push down and we should see relief. A 3-day bull div would be especially good because as I mentioned before we are in a downward price discovery and momentum indicators work well in those situations. Target could be made later, but right now it would be around the 50-62% fib, psychological resistance, and retracement of old long pole (11/20) at 5,000$. This play ideally works if today closes lower than it is right now. A green hammer close on today's daily might also signal the end of the move down, but it is less reliable than bullish divergence, so may be a good place to close a short (exit a trade) but not a good place to open a long (enter a trade). To avoid confusion let me remind you there is no 3-day bull div forming yet... I am speculating on what to watch for next week.