Late last week I posted a potential setup for a breakout trade for the AUD/NZD forex pair, that had recently been in a downward pattern.
At the time of writing the post I covered a number of bullish signal setups indicating the likely direction was for a move higher. I covered the setup by showing the weekly daily and 4 hour charts all showing bullish indicators for an imminent move higher
To check the post from last week setup for a breakout prediction for AUD/NZD click here to view it on Steemit.
The Breakout Is Confirmed
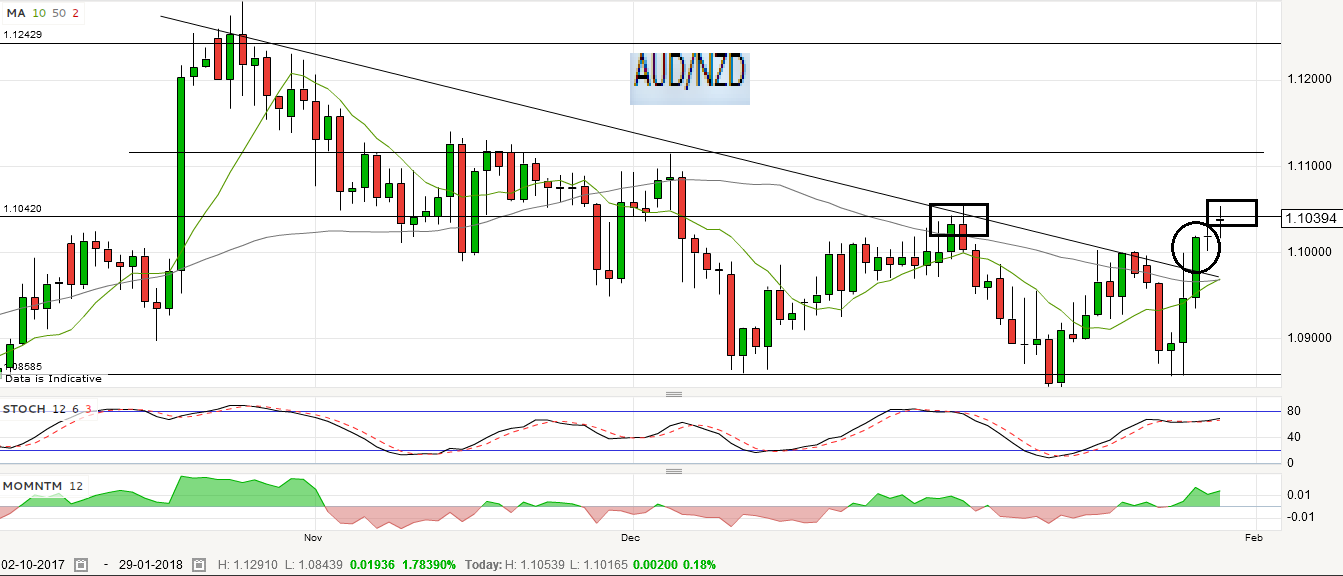
On Friday the breakout was confirmed as the price action continued to move higher and clearly closing out of the downtrend line as indicated in the chart below with the highlighted circle.
With today's price action the forex pair advanced higher and attempted to break out above its first resistance level that I indicated in the last post but later retreated lower. The resistance level is shown with the 2 rectangle boxes.

In the short term there is the potential that the price action may experience a pull back if it fails to clear above the resistance level in the next 24 - 48 hours. If this was to occur you may see the price fall to around the 1.10 or slightly below levels.
If the price action breaks out of the resistance level around 1.10400 the next resistance level is around 1.11100 - 1.11200 which is another 70 + pips higher.
Happy trading
Thanks for viewing this post.
Remember to Upvote and Resteem this post
If you want to view my recent Steemit post on Bitcoin's Trading Update click here
To receive future post please make sure you follow Crush The Market on Steemit
Please share any comments and questions on this post.
Disclaimer: This post is for educational purposes only, and all the information contained within this post is not to be considered as advice or a recommendation of any kind. If you require advice or assistance please seek a licensed professional who can provide these services.