Fibonacci measurements can be of considerable help when deciding on whether to buy or sell, or even just hold. Today I’m going to build upon a conversation with @mustang about current Bitcoin Fib retracements and just how these seeming trivial lines on a chart can quickly give you very important information regarding price action.
Fibonacci measurements can help you set important support and resistance levels in a matter of seconds, and it’s uncanny how they often line up with other important levels. Let’s draw the move from May 27 to June 11.

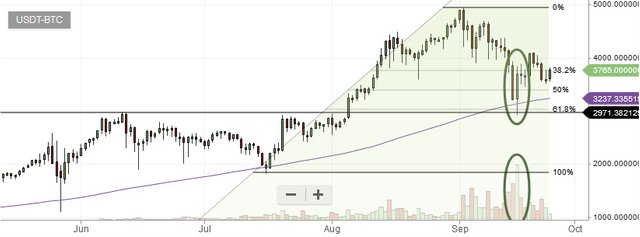
The next swing low came on July 16 after two previous defenses and was a direct 61.8% hit!
And with the next measured move higher, starting on July 16, that ended in new all time highs, where did the subsequent sell-off find support?
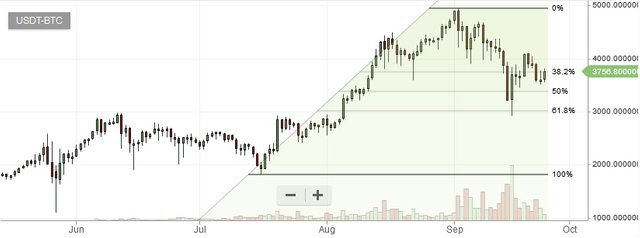
In spite of being a little sloppy (indicating emotional selling and capitulation), the 61.8% retrace marked the spot again! Would have been a lot of money made if you had trusted nothing more than those innocent looking lines on the chart.
But was the 61.8 really all there was? Or was it actually showing us where there was probably something more in terms of buy support?
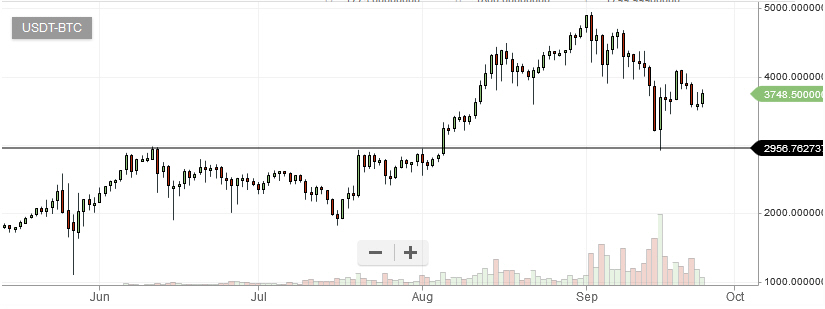
That’s what is called price support: former highs marking former selling resistance turned into support as those former sellers want back in.
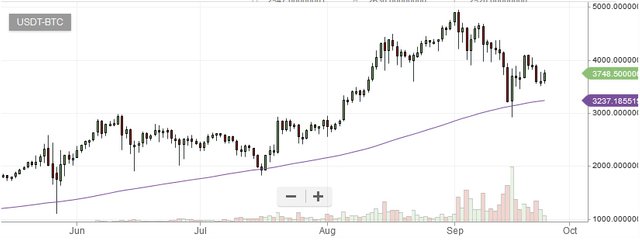
And the 110 Day Moving Average support also came into play.
How do we know then that the reversal is good and the level is confirmed?
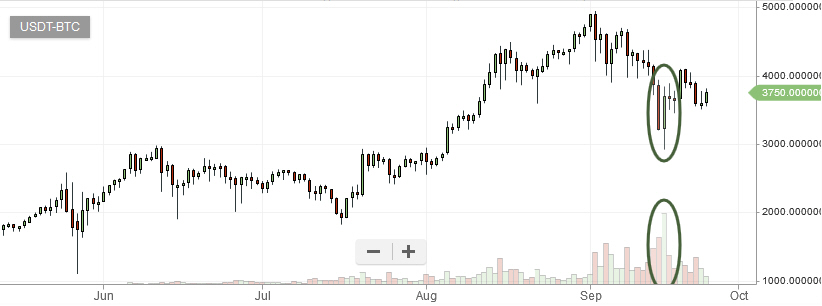
A huge green candlestick on huge volume with a lower tail indicating a test of lower prices that was aggressively bought taking price back almost to the previous day’s open and finishing as a bullish piercing on the chart is pretty solid confirmation of a key reversal at a significant confluence of support – all right where that Fib line was.
This is what that confluence of support and reversal that the Fibonacci draw was pointing to looks like all together:
So how about now? Is it smooth sailing to new highs from here? Unfortunately it’s not that easy. This works in the opposite direction too.
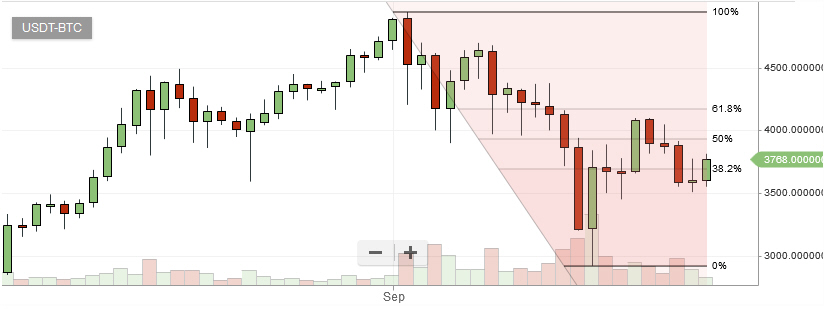
You can see that the Fib draw from the ATH to our recent swing low shows what is referred to as an opposing short setup that the market is currently respecting. And it’s not alone!
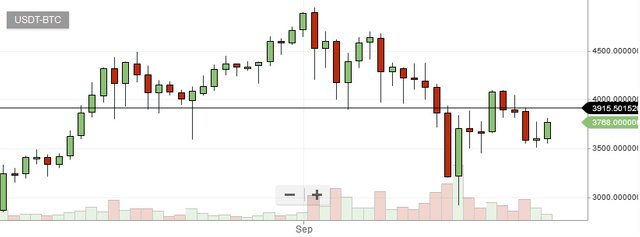
That was buy support during a distribution phase that looks very much like a former head and shoulder’s neckline, and it’s right at the 50%!
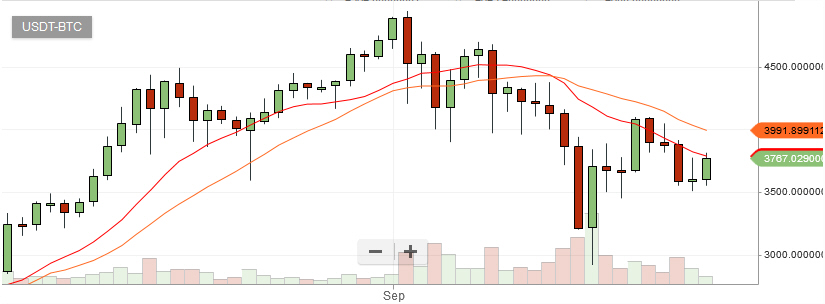
The 13 and 21 day moving averages are indicating short term trend-momentum pressure to the downside as well.

We’ve got a short term downtrend intersecting too.
Here’s the combined shot of the current confluence of resistance that the Fib draw got us onto:

We’re locked in a range. In Fib terms, that’s how we would describe the current situation. Price is inside both a measured long as well as a measured short, and we can readily see how horizontal S/R, daily moving averages and trendlines all confirm a coiling within a definite range. If you wanted to bet that BTC will go down, you’d sell at the upper end of the range (i.e. the 50%-61.8% of the measured short), and if you think it’s going to go up, you buy the corresponding Fibs on the measured long, but be careful, you might not get either since they’ve both already traded.
Here’s what it looks like all together:

So what to do?
Go to the hourly chart and perform the same operations.

And the discovery is yet another measured long, opposing the larger short, but still within the even larger daily long which represents the largest trend that we’ve seen so far. The 50% here just so happens to line up with short term price support. In this case the shorter term MAs are providing support as well, while the 110 hour MA is acting as resistance, the opposite of what we see on the daily, but further coiling nonetheless.
Let’s drill down further to the 15 minute chart.

Looking at that smaller measured move more closely, we see it’s coming off a pretty good looking cup and handle double bottom / triple bottom with fairly good volume confirmation whose 50-61.8% retraces line up with the neckline(s) of that bottoming formation. The moving averages, inverted yet again, with the 110 MA coinciding with both price and Fib support, are confirming.
3660 looks like a great entry for anyone looking to get long, but it’s always an unknown. Nothing is guaranteed. A short term trader might put a stop just under the 61.8 at 3620ish. The long term investor just smiles and sleeps well knowing he or she has chosen to enter at a very nice time and place.
And if you still don’t know whether you are an intermediate term bull or bear (we’re all long term bulls, right?), instead of zooming in, zoom out to the weekly.

Yeah, it’s possible price comes back down to 3000, but would you say probable? Maybe? The long term investor would smile an even bigger smile upon being able to add even more down there!
DISCLAIMER: This is not investment advice. It is only a real time illustration of how technical analysis using Fibonacci measurements as a starting point can help the analyst to reach better probabilistic conclusions regarding price action. This is meant to be nothing more than knowledge sharing with the intent to help others learn more about TA and better do it on their own. Only you are responsible for your investment decisions.
And with that I wish you the best of luck with perfecting your TA and invite you to stick around with any questions, feedback and/or tools and tricks of your own that you’d like to share. We’ve got a great opportunity here on STEEMIT to build a productive and rewarding community, so let’s do it!
Price indeed came back down into the buy zone, but now we've got another, smaller opposing short to get through. Confirmation of the long comes with the break of the opposing short's 61.8%. Volume is looking lethargic - the old saying is "don't sell a dull tape" - let's see if we get some buyers coming up to the plate.
Downvoting a post can decrease pending rewards and make it less visible. Common reasons:
Submit
Okay, things are looking very technical, which is good as it's an indication that professionals are involved, and volume confirmation is positive as well.
We got through the first opposing short, and now have a new long setup (entry at 3730ish) with full rainbow MA support within the larger hourly long, both targeting above the 61.8 of the next opposing short, but, and this is a big but, that's also the 50% level for the daily opposing short. We'll need to follow this closely!
Downvoting a post can decrease pending rewards and make it less visible. Common reasons:
Submit
Congratulations @cryptographic! You have completed some achievement on Steemit and have been rewarded with new badge(s) :
Click on any badge to view your own Board of Honor on SteemitBoard.
For more information about SteemitBoard, click here
If you no longer want to receive notifications, reply to this comment with the word
STOPDownvoting a post can decrease pending rewards and make it less visible. Common reasons:
Submit
Thank you and glad to be able to do my small part to "give something back"!
Downvoting a post can decrease pending rewards and make it less visible. Common reasons:
Submit
@originalworks
Downvoting a post can decrease pending rewards and make it less visible. Common reasons:
Submit
The @OriginalWorks bot has determined this post by @cryptographic to be original material and upvoted it!
To call @OriginalWorks, simply reply to any post with @originalworks or !originalworks in your message!
To nominate this post for the daily RESTEEM contest, upvote this comment! The user with the most upvotes on their @OriginalWorks comment will win!
For more information, Click Here!
Downvoting a post can decrease pending rewards and make it less visible. Common reasons:
Submit
Nice TA
Downvoting a post can decrease pending rewards and make it less visible. Common reasons:
Submit
Glad you liked it. I see you're relatively new to Steemit - welcome to the community, and do stick around, this won't be my last. 😉
Downvoting a post can decrease pending rewards and make it less visible. Common reasons:
Submit
this is really nice from you i like it
Downvoting a post can decrease pending rewards and make it less visible. Common reasons:
Submit
There's a reason why your reputation is 6 - it looks like you're a little too "trigger happy" with resteeming and your comments are often cut and paste repeated. I'm sure you're well intentioned, but those kinds of "contributions" are going to work against you regardless. I recommend personalizing your comments, and slowing way down on your resteeming.
Downvoting a post can decrease pending rewards and make it less visible. Common reasons:
Submit