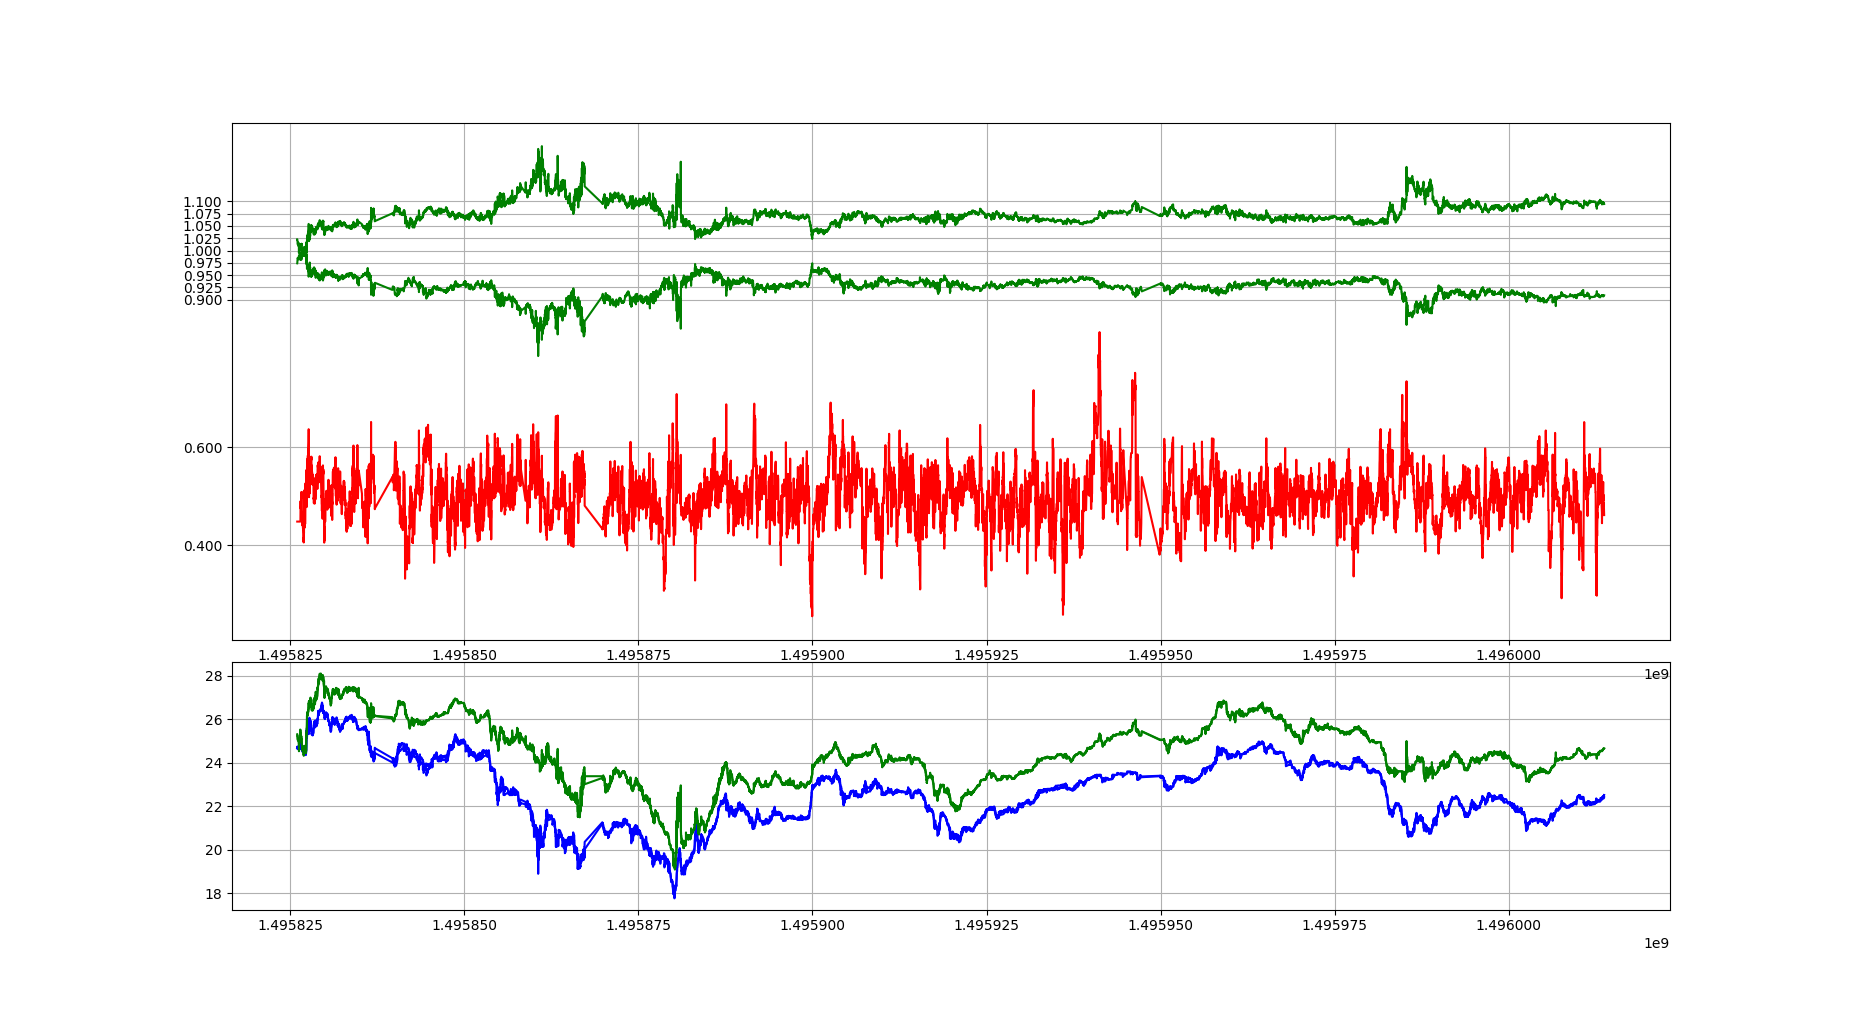
So often here on steemit people are posting their "future insights" about the price of X coin, Almost 90% of these posts reference only technical analysis. There are many more similiar concepts about why past data(which is what all TA uses), cannot predict future price movements.
The first theory is the "Random Walk Hypothosis"
A researcher started a stock at 50$ and then flipped a coin, Heads he added 50 cents Tails he subtracted 50 cents from the stock price. This data was charted and given to many so called "chartests" and was in distinguishable from real trade data. In fact my chartists enocouraged the researcher to "purchase immediatly" because the underlying would jump 15% according to the chart.
https://en.wikipedia.org/wiki/Random_walk_hypothesis
The second theory is "The Efficient Market Theory"
This thoery which claims that all available information is already priced in to the current price, And it is therefore it is impossible to Buy under valued assets or sell over valued assets. While the cryptocurrency space may have not become a truely "efficient market" yet, We are nearing that position quickly.
https://en.wikipedia.org/wiki/Random_walk_hypothesis
What do you guys think? Are markets predictable?
Price action is just a reflection of all it's participants. While I think technical indicators are largely just window dressing, there are certain patterns and situations that often yield similar results. If you only trade those it is possible to have an edge.
Downvoting a post can decrease pending rewards and make it less visible. Common reasons:
Submit
I would have to guess your referencing The StochRSI or RSI when saying TA has any edge. While over a short term you may find profitable trades. It is almost certain if you relied on any TA indicator or multiple indicators alone. Over time you would loose more then you gain.
Either that or your saying "buy the dip" :P
Downvoting a post can decrease pending rewards and make it less visible. Common reasons:
Submit
Actually that is the opposite of what I am saying. I am saying that certain price action patterns tend to repeat themselves, such as overbought and oversold conditions combined with several other indicators provide for scalping opportunities.
Downvoting a post can decrease pending rewards and make it less visible. Common reasons:
Submit
So more alike to "head and shoulders" or "3 buddhas"
Downvoting a post can decrease pending rewards and make it less visible. Common reasons:
Submit
Heyo @cryptohustlin, I donated to minnowpond but think it might have bugged out on me, lol, it is an automated list? Maybe I'm just missing something :p
anyway sorry for off-topic, just thought I should mention it didn't add me.
Downvoting a post can decrease pending rewards and make it less visible. Common reasons:
Submit
hey i mentioned this to @cmtz hes going to take a look at it. I think it may have to do with the API NODE we were using for the bot being intermitantly out of reach. (we dont run our own API NODE yet)
Downvoting a post can decrease pending rewards and make it less visible. Common reasons:
Submit
cool, thanks for the reply, steem on ^_^
Downvoting a post can decrease pending rewards and make it less visible. Common reasons:
Submit
Interesting view point you have @cryptohustlin
I am new to Steemit so i do not have any analysis on the trades that i have done, but if you keep up to date with my page i think you might change your mind on the whether or not technical analysis might actually not be as random as you think 😁
Just to give a very quick overview we have two types of ways to analyze the market: Fundamental and Technical. (This you already knew of course)
However when we breakdown Technical analysis 2 more sub categories come up.
One is using Indicators, which are the mathematical based algorithms that try to predict the future based on PAST data.
Second is Purely based on price action also known as naked trading. This is my preference due to the fact that most indicators are known as lagging indicators which repaint and give a lot of false signals.
Without going to deep into strategies or anything think about this for a second..
What makes any market move?
Answer: Volume caused by buying and selling.
Therefore if you can predict when large quantities of volume will enter the market then you should be able to also predict the market rising or falling based what people have agreed to do with those contracts or coins.
In the comment below @jrcornel speaks about chart patterns. Lets say we use the statement i explained above about volume.
Then lets say JP Morgan and Goldman Sachs each buy $500m worth of #BTC that immense amount of sheer volume alone will move the market. Now lets say their traders used chart patterns in order to put in the orders in the market when they themselves did their analysis then If you use the same pattern by default you will make money because you will be riding the wave of the volume they added.
Moral of the story dont use indicators and trade chart patterns to "follow" when the "big boys" will enter and exit the market. Again that is the ONLY way the market moves - huge quantities of money being moved around.
Downvoting a post can decrease pending rewards and make it less visible. Common reasons:
Submit
Congratulations @cryptohustlin! You have received a personal award!
Click on the badge to view your own Board of Honor on SteemitBoard.
For more information about this award, click here
Downvoting a post can decrease pending rewards and make it less visible. Common reasons:
Submit