Day Trading is the dream job. You just have to develop your own style and follow your own system. I am a visual person so my style is to follow a chart that has simple indicators to show me when to get in and out of my trades. When day trading the TF my goal is to trade for one to 3 points a day. I like to work up to 10 contracts per trade. That means a $1000 to $3000 day. Since the TF market usually moves 10 to 15 points a day the goal is to find the swings that will give you the one to 3 points.
I like to use what M. A. Perry (thestrategylab.com) calls Wide Range Bars with a Hidden Gap (WRB). These bars have a sudden volatility that indicates a major move. M. A. Perry has lots of ways of using the bars but to me the KISS method is just to use the bars in different time frames for you triggers and setups.
Finding the right place to look for your triggers and setups is also key. The market moves in waves or sideways between different support and resistance (SR) levels. The main SR levels I watch for to set up the context are the opening Gap, Camarilla Pivots and Fibonacci %50 retracement levels.
The opening gap is when the market on opening at 6:30 PST goes to the previous days close. So if I get a WRB in the direction of closing the gap I take the trade. This is also based on context if the gap is more the 10 points I may not take the trade.
The Camarilla Pivots are 10 different levels of support based on the previous day's range. I use the 3,4,5 levels above and below the midline. The market moves to these levels like a magnet. Franklin Ochoa has written an excellent guide on how to use the pivots in his book "Secrets of a Pivot Boss: Revealing Proven methods for Profiting in the Market"
The market moves in waves based on Fibonacci %50 retracements also called Half Way Backs (HWB). So if the market has made a %50 retracement then is a good time to take a WRB in the direction of wave 3.
I also like to watch momentum with John Carter’s Squeeze indicator in the bottom of the chart. This not only shows the momentum but divergence and direction and whether the market is going sideways or moving.
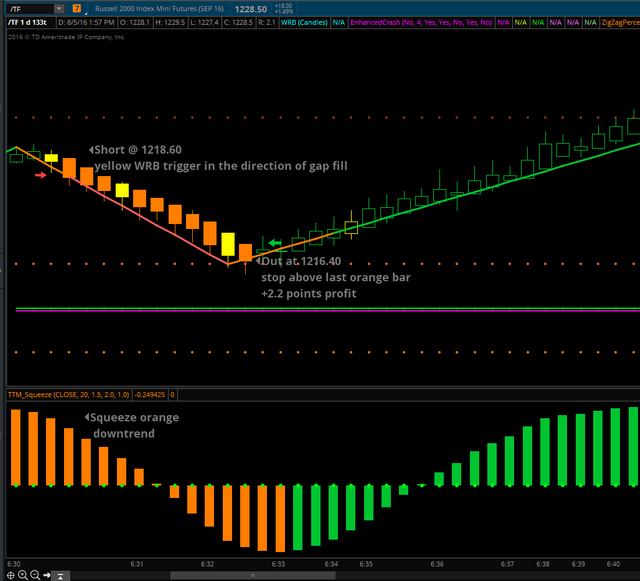
Below is an example of an Opening Gap trade from last Friday. The Yellow bar is triggering a short trade to close the gap the Squeeze indicator is saying go short also. When the next bar after the yellow bar goes below the yellow bar that is the place to get in. I usually use a 10 tick stop and quickly move it to break even then follow the top of the previous bar down. This results in a great trade in just a few minutes.

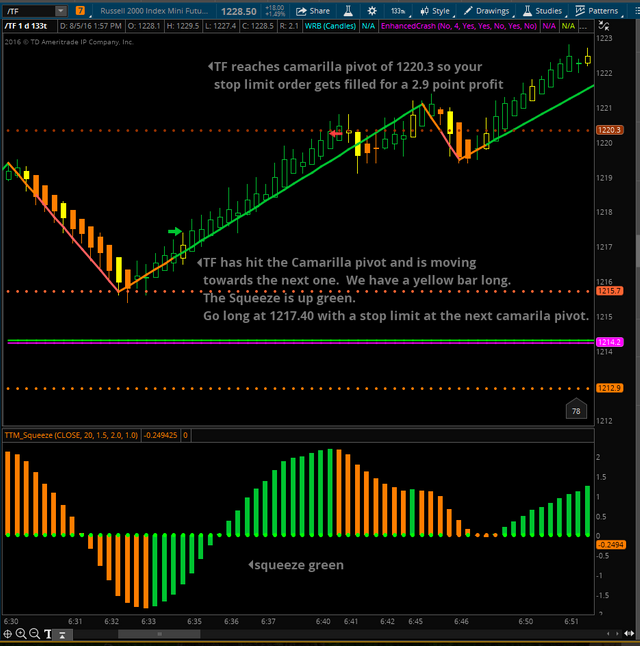
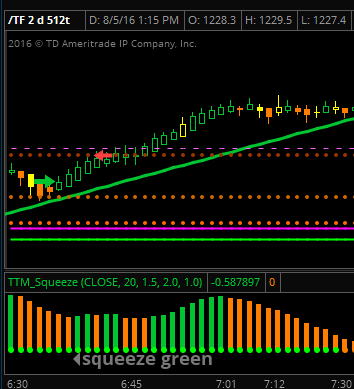
In the same morning we also have a Camarilla pivot trade a few minutes later the bars turn green and the Squeeze turns green then we get an open yellow bar moving from one Camarilla pivot to the next one. We go long on the price of the top of the yellow bar and place a stop limit order to be filled at the next Camarilla pivot. I also place a protective stop at the low of 1 bar back on the 512 tick chart that I also follow as it moves up in case it does not make it. I use the 512 tick chart for the longer term context and also use the WRB (yellow bars) to trade that especially for the HWB trades. We make 2.9 points on this trade. So in about 15 minutes we have placed 2 trades and made 5.1 points which is $5,100 for 10 contracts or $510 for one.


You will also notice that on my charts I use the ZIG ZAG indicator. This is the line through the bars that changes color when the trend changes and also shows the waves more clearly. When the bars go past a previous high or low they usually go further with the trend. I will update this with more hints soon.