This is a short guide how you can see correlation between any two trading instruments on Trading View.
STEP 1: Choose your primary trading instrument. In our case we will use the BTCUSD, with a feed from BitStamp.

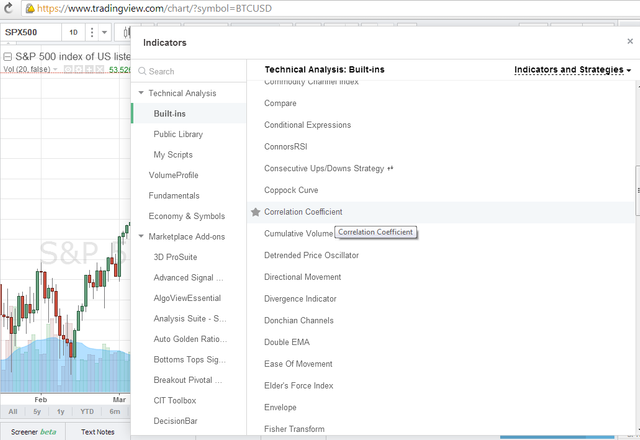
STEP 2: Click on Indicators. This will show a long list of built-in TV indicators. Scroll down to the 'Correlation Coefficient' and click on it. Alternatively you can search for 'Correlation Coefficient' in the search box to the left.

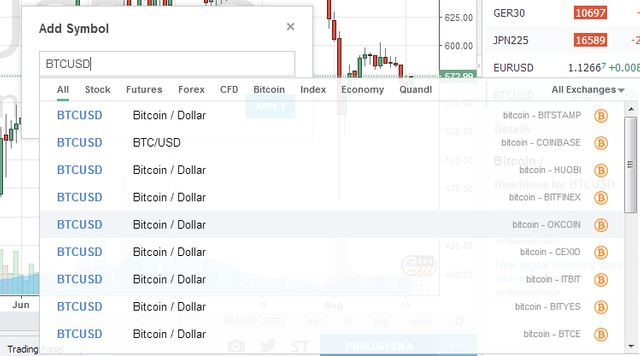
STEP 3: Choose your secondary trading instrument. In the box that shows up, we again type in BTCUSD and pick OKCOIN from the list of data providers.

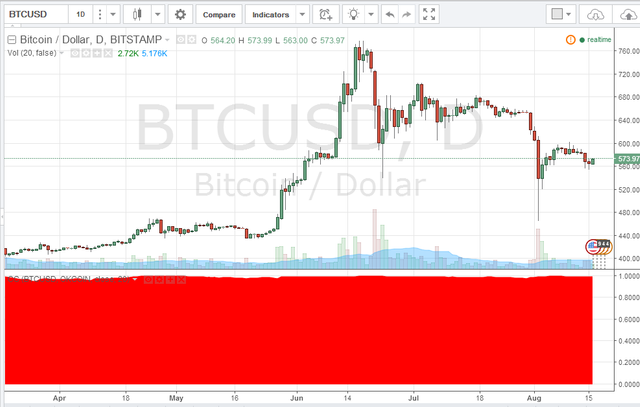
On the final snapshot below you can see the final result. The 'Correlation Coefficient' is displayed in the form of a red histogram, with values ranging from 0 to 1. The closer we are to 1, the higher the positive correlation is between the two trading instruments. On the chart below we can see that the correlation between our two choices approaches 1 almost all of time.

This is to be expected, this is the same trading instrument BTCUSD and prices across exchanges tend to be 'brought in line' by arbitragers.
In other posts I will explore some of the most hypothesized correlations in the crypto space like Bitcoin and the Chinese Yuan or Bitcoin and Ether. Is there truth to these correlations or are market participants just seeing what they want to see? Follow me to find out https://steemit.com/@forextrader
I think, the price will go below
Downvoting a post can decrease pending rewards and make it less visible. Common reasons:
Submit
@forextrader Thanks for this. I just tried it out on ETHBTC and BTCUSD. Interesting.
Downvoting a post can decrease pending rewards and make it less visible. Common reasons:
Submit
Tnx! I will probably post a separate article on the Ether vs Bitcoin correlation. Now working on one for Yuan vs BTC.
Downvoting a post can decrease pending rewards and make it less visible. Common reasons:
Submit