"What the hanky poop is an indicator?"
I see all this garbage and have no clue what all this is… a bunch of squiggly lines here and some arrows there, with a piece of string here and a a shady area there. I am sooooo confused! Believe it or not, this was my first impression of indicators and oscillators.
Ryan’s definition of an Indicator – This is some type of helper on your chart that may help you with decision making. It may be something like a moving average or bollinger bands.
Ryan’s definition of an oscillator – This is the same thing as an indicator but it is in a separate window, usually under the actual price chart.
There are all kinds of indicators. There is no set number or guide because you can make up your own indicator if you want. The basic indicators will tell you where price has been and where price is likely to go. Some of the more obscure indicators will tell you what the Moon Phase is, in relation to trading (Which I think is a bunch of garbage, btw).
If you look on the internet, you may get confused with lagging vs leading indicators, multi-threaded discombobulated technical jargon. We are going to try to break it down for you today. From here on out, we will refer to ALL indicators and ALL oscillators as indicators. Let’s take a look at one popular indicator and we can show you how to use them. We will be starting with a moving average.
Let’s look at a chart with no indicators on it…
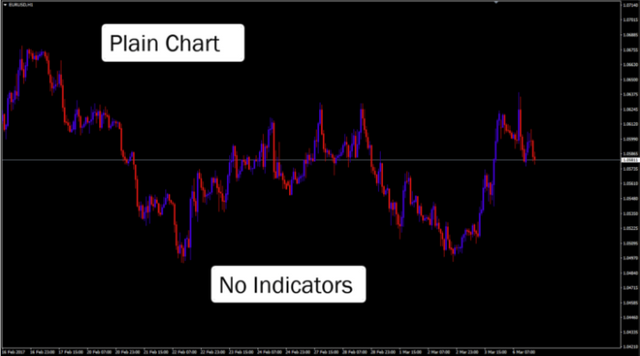
On this chart, you can see where price has been. You can see the variations in the way price has been moving over time. You can see where price is now and the slope of an uptrend or downtrend. What you may not be able to see if an entry signal for a potential trade. Of course, you ‘could have sold’ this price at some point in the recent past but where? There is not a point of reference yet for you to build upon. Let us throw an indicator onto the chart to give us a better view…
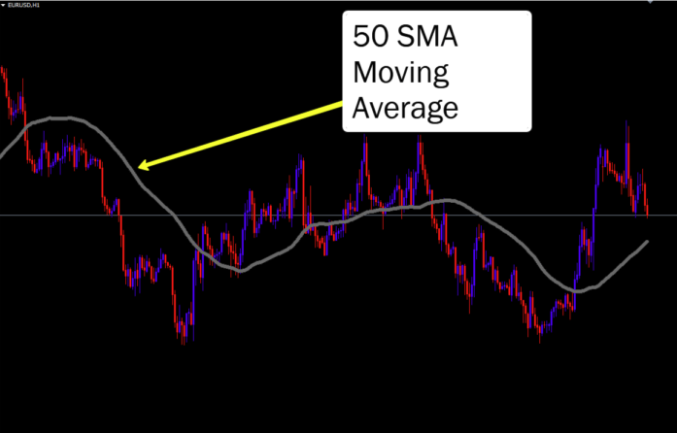
Ok now we can see with a little bit more clarity. We know by looking at this that price is below the ABOVE price over the last 50 periods. This is what a simple moving average indicator will show you. If you have it set to 50, which we do in this scenario, then it is going to show you where the average price should be, according to the last 50 bars. Just follow the black line and you can see that the current price is above the average price (dictated by the black line). There are other factors to it, including sloping, etc… but for now, let us just assume that price is ABOVE the moving average so price is strong ‘right now’.
But do we have an entry point yet? NO. Let’s throw on another moving average for clarity…
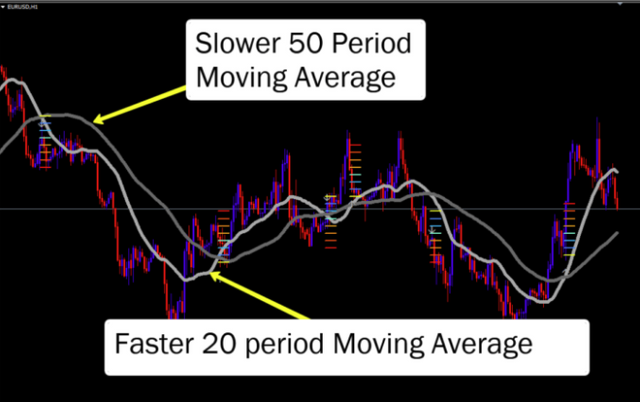
Ok so now we have 2 moving averages on the chart. This gives us a better picture of what is happening and also gives us an entry point. We know now that price is above the average price over the last 50 bars. We also know that price is below the average price over the last 20 bars (That is what the 20 Simple Moving Average does). And we have an entry point now on each ‘crossover’. Take a look…
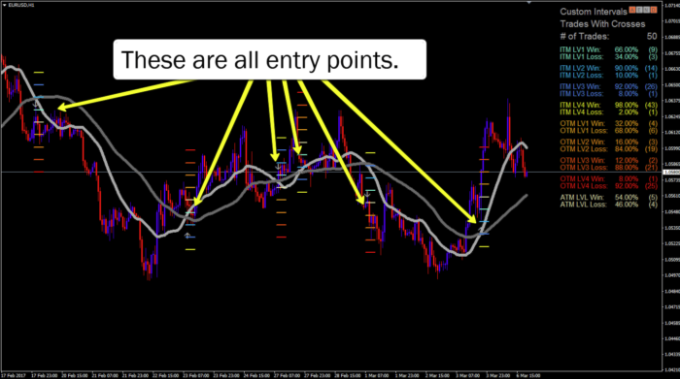
Don’t worry about being able to read the chart yet. Just go with me for a minute…
We can look at this and say, ” I will sell this pair when the 20 Simple Moving Average crosses below the 50 Simple Moving Average. I will buy this when the 20 simple moving average crosses above the 50 simple moving average.” This is the beginnings of a basic trend following strategy. (By the way, don’t do this because it doesn’t work. You have to tweak it a bit.) This is for clarity on how to read indicators, etc… When it is all said and done, you can have a ‘bigger picture’ view of the market and where you may want to buy and sell…
Oscillators
You can see from the picture above that you have entry points. This is one type of indicator. Let us dive into another type called oscillators. Oscillators are often displayed below a chart and tries to show periods of overbought and oversold. I am going to say something that totally contradicts what the ‘majority’ teach out there.
OVERBOUGHT AND OVERSOLD IS BUNK! YOU HAVE TO ANALYZE THE CHART BEFORE SAYING SOMETHING IS OVERBOUGHT OR OVERSOLD. BUYING IN AN OVERBOUGHT AREA CAN BE POWERFUL AND SELLING IN AN OVERSOLD AREA CAN ALSO BE POWERFUL.
Let’s take a look at a common oscillator. We are going to examine the RSI (Relative Strength Index). The RSI moves from o to 100 where 0 is oversold and 100 is overbought. The closer the oscillator line moves to 0 or 100, the more oversold or overbought. It is commonly thought that the 20 to 30 line is a good entry point for oversold and the 70 to 80 is commonly referred to as a good entry point for overbought. Let’s look…
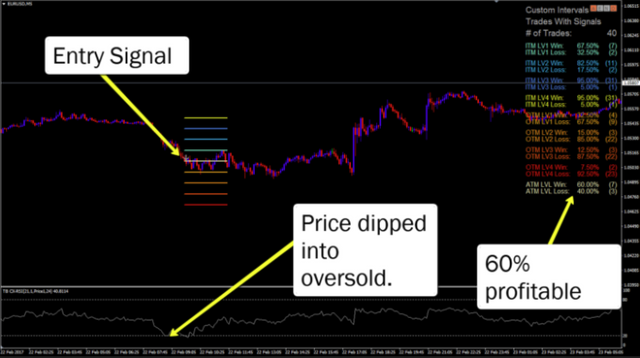
You can see, from the picture above that the oversold area isn’t overbought at all. Price just keeps falling for a period of time. This indicator is useful in certain circumstances but to just sell when price reaches an overbought area or to buy when price reaches an oversold area is absurd. It doesn’t work at all.
One thing, among many, that does work is using the RSI in conjunction with binary options.
Remember that time I said you could write your own indicators? Well that’s exactly what we did.
We took common indicators and slapped our kick booty stuff on them to create a whole new experience for indicators. These indicators help us with the probabilities of every trade and you can read more about these later. Above is a picture of one of our proprietary RSI based indicators.
With our TraderBot Marketplace CX-RSI, I can see things such as
- How often a strike touches, expires, or touches and reverses within a set amount of time
- How many wins and losses in a row has been created
- What the average pip profit and loss is
- OTM, ATM, ITM probabilities
… and a whole lot more.
You don’t need our indicators, although they are very much awesome!, but you do need to know the stats about every trade you place, before entering the trade. If you don’t know the stats, just go home.
There are all kinds of indicators such as bollinger bands, MacD, Inverted Movers, ADX, and about 1,000 others. One thing new traders must realize is that the majority of indicators will tell you about the same information. You don’t need RSI on your chart if you already have Stochastics. You don’t need MacD on your chart if you already have RSI. They say the same things.
Many sites on the internet will give strategies like, ” Take the trade if RSI gives a signal but only if confirmed with the MacD, and Stochastics. The look for a moving average cross to confirm.” HOGWASH I SAY! Look, pick one or two things and work with them. Don’t fall into the trap of analysis paralysis. Analysis paralysis or paralysis by analysis is the state of over-analyzing (or over-thinking) a situation so that a decision or action is never taken, in effect paralyzing the outcome.
Indicators are great. You just have to pick one you like… One that speaks to you… and use it. Create rules around it. Create a positive expectancy and trade with it. It’s doesn’t have to be that complicated and you don’t have to know what every indicator means, under the sun.
Pick one or two indicators and get good at that.
