Hello everyone.
I would like to share my most profitable trading strategy for scalping profits on the minute charts, using this technique I am able get at around 3% profit daily (some days some 50% depends on volatility) with almost 0 risk, and if I ever get into some risk I try to mitigate damages as much as possible. That said I do live on the charts almost 20/7, and I am an opportunist.
First of I would like to say that this is not sure method and I am not telling you should buy at every single signal on the indicators. Also in my opinion you should treat all day trades as "pump and dumps" what I mean is you should get out of the investment and move onto BTC or something.
That out of the way, my method is a variation of strategies used on the "conventional" forex exchange, also this is not an exact science its pure speculations and any way I can improve its appreciated.
Trading strategy: 3 EMA based on "Fibonacci scale numbers", Bollinger Bands, Money Flow Index, RSI and MACD
Now before you crucify me for using so many indicators bear in mind i am extremely paranoid when day trading crypto, so I like to have a lot of indicators.
If you are new to any of these indicators I can gladly expand on further articles and I will also try to be as clear as possible on this one.
The Moving averages are well averages which values are taken from closing price of the asset in the period its set to. The strategy behind the EMA lines its rather simple, you wait for the "fast" EMA (the lowest one) to cross above all the other EMA lines, when that happens its usually the start of an uptrend, also when the Price graph its trading above the fast EMA it means its probably going up significantly.
For this strategy I use EMA 5, 8 and 13.
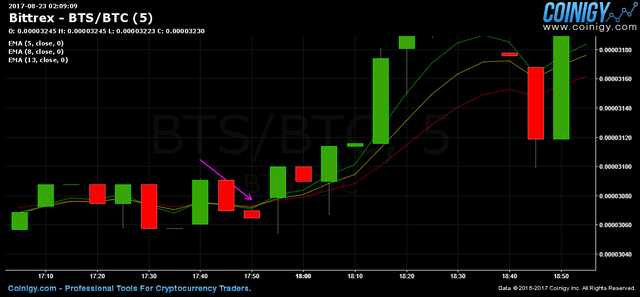
See how once the green EMA line cross the rest it goes into bull run. And once the price trades above the EMA it goes really hard.
Next Indicator its the Money Flow Index; MFI.
Both the MFI and the RSI are oscillators that help us realize when a coin price its oversold/overbought. The MFI uses both the price and volume into the equation. The trading technique behind both oscillators its very simple when the value in the oscillator falls below threshold it means the asset its getting oversold, at that point a reversal its very likely . Note that it can be a false positive and the value can drop even further you don't want to buy on every signal.
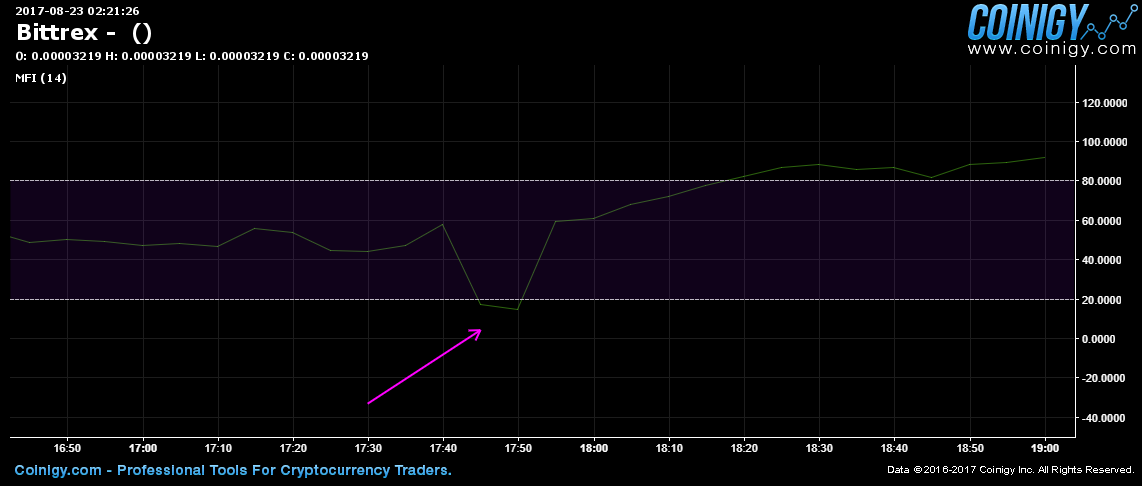
This one merged with the last.
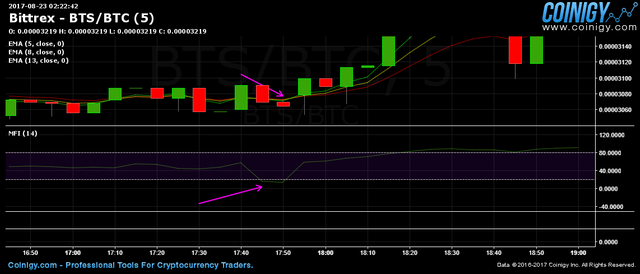
At that point I like to confirm the trend with the MACD

Selling
For the selling we can do the opposite, wait for the MFI to reach an "overbought" status and try to sell of before it comes down. (sometimes its very fast in volatile coins) At this point the hardest part its making sure you sell off the coin and your order goes thru.
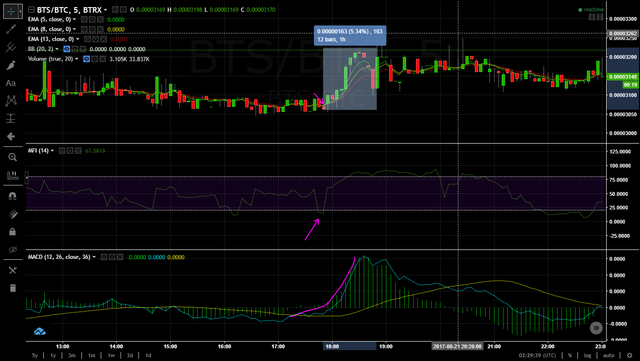
So if you hypothetically buy in at the lowest point and sell of at the highest you get a potential 5.34% on that bull run in around 1 hour time frame.
Bollinger Bands
I like these to measure the potential trends and paths the price can take. The 2 extremes are at 2 Standard Deviations from the EMA.
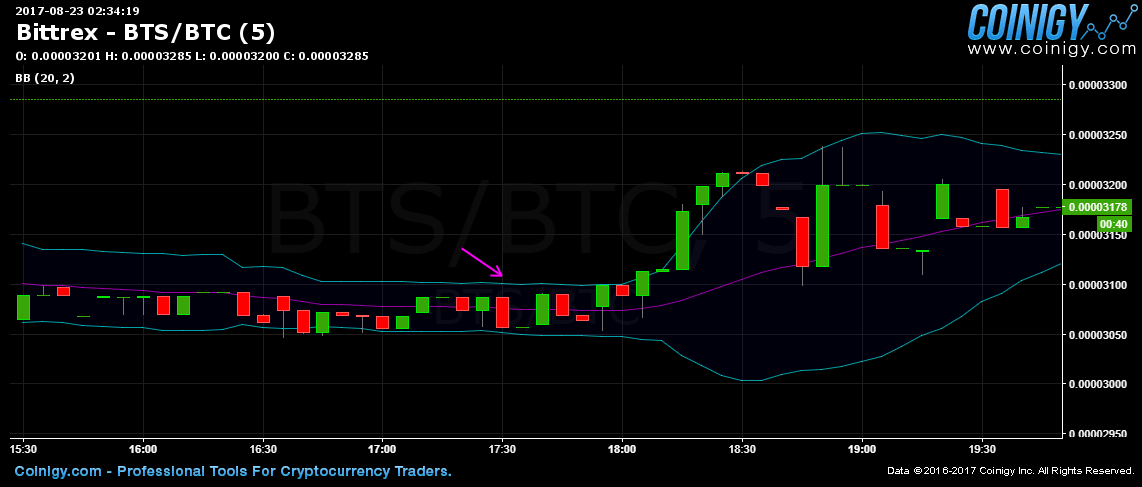
The arrow its signaling to something called the "squeeze" period when the bands are squeezing the price and its on a consolidation period. When the bands widen those are the extremes the value of the coin can reach, Also when the Price graph its above the EMA on the bands its usually a bull run, and when its the other way around its a bear market signal. Again this is a skim overview I encourage you to read further into it.
Happy trading! Isaac.
thanks for sharing :D
Downvoting a post can decrease pending rewards and make it less visible. Common reasons:
Submit
You are welcome, and thank you for the comment.
Downvoting a post can decrease pending rewards and make it less visible. Common reasons:
Submit
welcome
Downvoting a post can decrease pending rewards and make it less visible. Common reasons:
Submit
Would love to see a video of your latest trading strategies, Isaac. This post is about 8 months old and I think you'll have gotten a lot better now.
The thing is about videos is that 99% of people show you "after" the fact. They don't show live trading which is annoying. It's easy to say I bought here and I sold there when the chart is already on the next day or week.
Cheers mate.
Jimbo
Downvoting a post can decrease pending rewards and make it less visible. Common reasons:
Submit
Downvoting a post can decrease pending rewards and make it less visible. Common reasons:
Submit
Likewise :)!
Downvoting a post can decrease pending rewards and make it less visible. Common reasons:
Submit