Introduction
With this post, I will continue sharing content on trading strategies, today I will describe some aspects of the Williams% R Indicator, this indicator is one of the classic indicators within the technical analysis widely used as a simple oscillator, which serves to identify the areas of selling pressure and buying pressure, and the most convenient potential entry and exit points, as it also works as a momentum indicator.
This classic technical analysis tool, the Williams% R Indicator, was devised by the famous American trader Larry Williams, on the other hand, it is important to note that the Williams% R Indicator correlates with the stochastic, and with the Relative Strength Index or RSI for its acronym in English, so it is intuitive that reveals graphic readings that work similarly to the two indicators already mentioned.
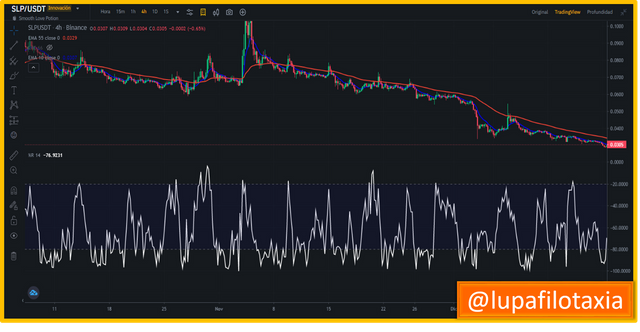
The graphical readings revealed by the Williams% R Indicator serve as a guide to determine which segment of the market is in control (bullish/bearish), taking into account that, when the indicator is above -20 approaching 0, this indicates that the bullish traders have reached their maximum strength, and in the opposite case, when it approaches -100 it indicates that the bearish have reached their maximum strength, and decide to close prices at the minimum of the period.

One of the most outstanding technical functionalities of the Williams% R Indicator, is that it can be executed in predetermined configurations of (n) periods in any timeframe; hourly, daily, weekly, monthly or any other period of time of the trader's preference.
Another functional element of the Williams% R Indicator is that the value of this tool fluctuates in a range from 0 to -100, values below -80 represent a signal that the financial instrument is under selling pressure, therefore, there is a probability that the price will increase.
At the opposite extreme, i.e. when values are above -20 and projected to 0, this can be interpreted as a sign that the financial instrument is under buying pressure, therefore, there is a probability that the price will depreciate or fall.

OBSERVATION:
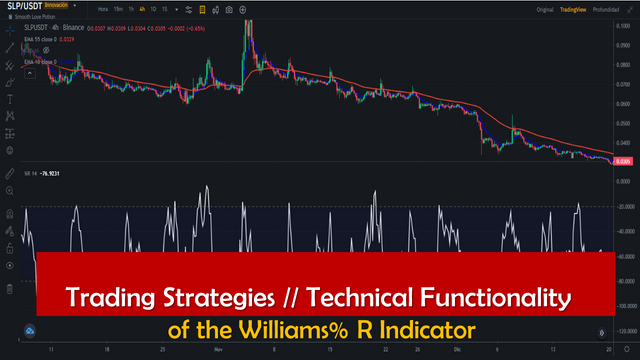
The cover image was designed by the author: @lupafilotaxia, incorporating image background: Source: Binance

