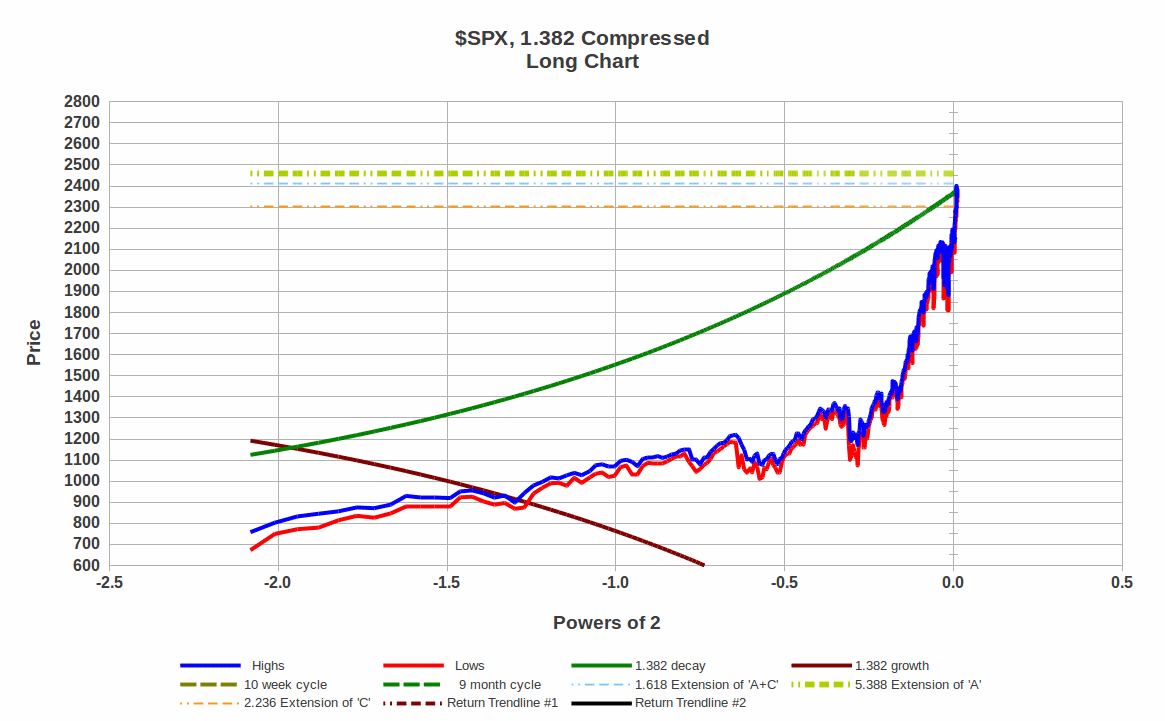
With the debt crisis approaching with an incredibly divided Government, It's interesting that by a method based on the Logarithm of Time, we sit at resistance lines and at a time node '0.0', on the 1.382 Compressed Long Chart. The arrival at such a major node while touching a trendline in combination is a strong reversal pattern, although it could hang up there for several months if it wishes to before it decides to fall over....Time (on the horizontal axis) is stretched from the left edge to the middle but compressed from the middle to the right edge meaning that a small increment of travel on the right side implies quite a bit of time. The numeric values along the bottom is a substitute for calendar (linear) time but by the shape of the curve, you can correlate it to a standard stock chart and the market events that have transpired since early 2009, which is where the curve originates at the lower left edge.

