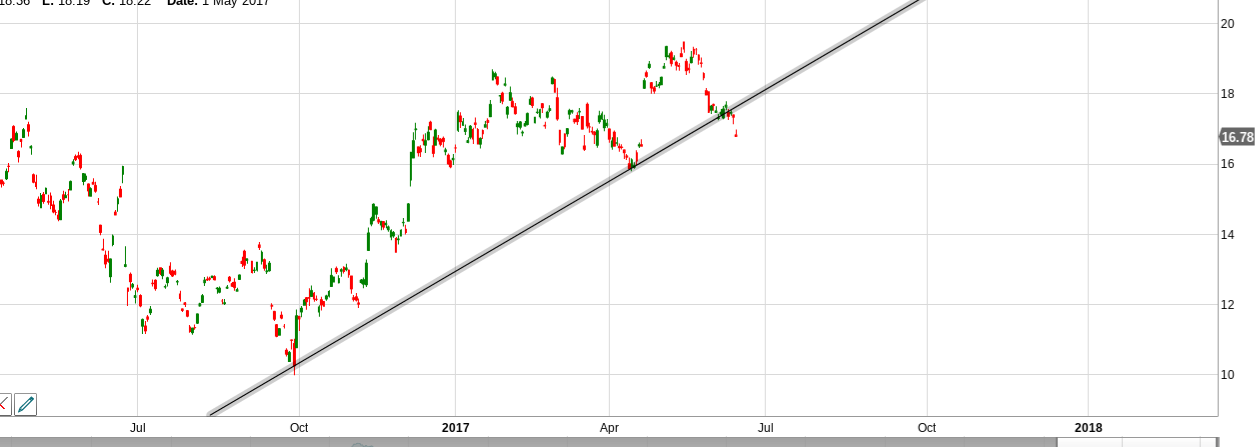
A lot of Traders Target BREAKDOWNS & BREAKOUTS These Characterised as a BREAK of an 'IMPORTANT' DIAGONAL.. but ONE DIAG'L NEVER Gives U the WHOLE Picture OR Indeed WHERE PRICE is Heading...This is WHY I Created #MULTIDIAGONALS... Take DB (below) a seemingly MAJOR DIAGONAL is Broken so are we to Assume PRICE is going to PLUNGE?

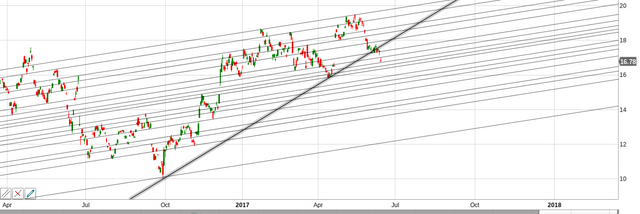
But Look again Once the PREVAILING DIAGONAL is Applied..
PRICE Can Stop at ANY One of these Lines... to Calculate WHICH ONE we must Apply SEVERAL PRIMARY DIAGONALS to Create a CONFLUENCE(meeting point) ONLY Then can we Calculate Likely Target..Thanks for taking time to read this ..hope it helps to advance your Trading Profits..
what target do you get with your confluence?
Downvoting a post can decrease pending rewards and make it less visible. Common reasons:
Submit
Could you do an updated LSE:AEG chart if you have time please?
Downvoting a post can decrease pending rewards and make it less visible. Common reasons:
Submit