The Aussie dollar testing back yearly support level at 0.7180.
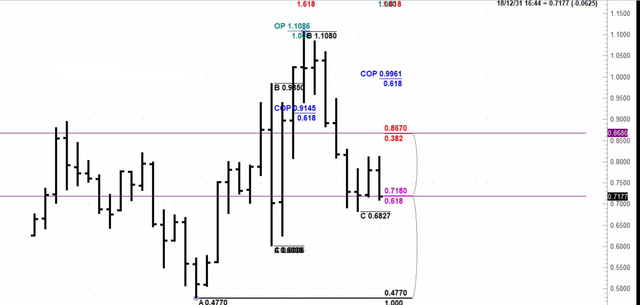
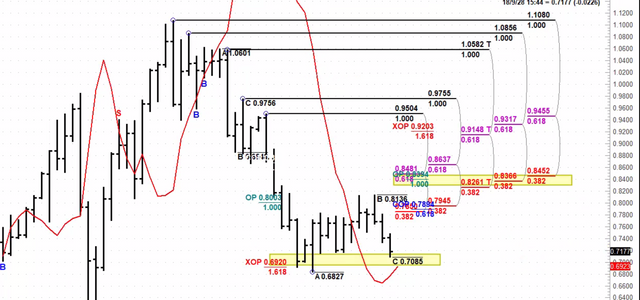
Looking at quarterly chart; very weak dynamic pressure on buy signal , market testing first 0.318 resistance and starts falling down. Yearly support level at 7180 stands as a fulcrum level if the market cant on it hold this will be bearish for aussie with the quarterly trend change approaching. On the upside 0.84 stands as massive resistance zone.
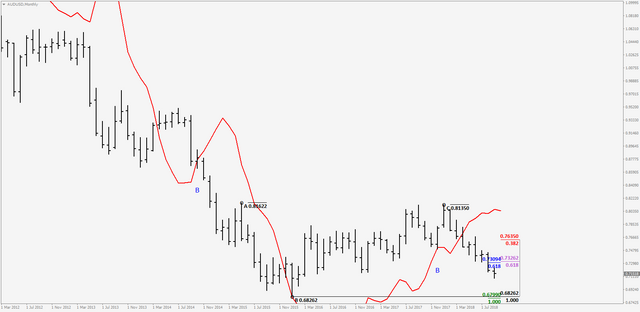
On the monthly trend is down; market closed below 0.618 fib resis. + fib extension agreement zone and taking out the stops below 0.7140ish. If we dont see a wash rinse; the next target will be 0.6799 just below the lows.

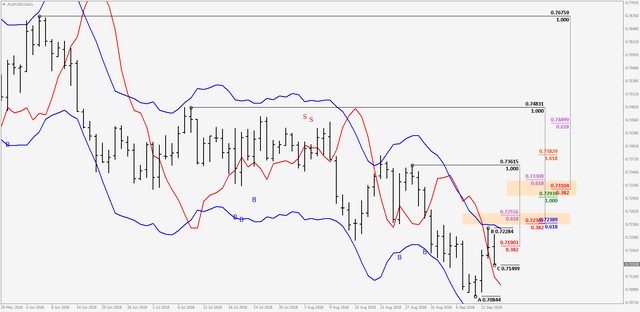
Weekly trend is also down. We had a confirmed buy on daily but couldnt get folllow through on that. If the market can achieve to push higher first good resıstance zone stands at .7230-.7250 (market will be OS too) and more resistance higher up at .7290-.7330.

So on the long term lets monitor yearly fulcrum level at .7180 together with quaterly trend change. On the montly fib extension just below the lows at .6799 is important. And lets see how the market reacts at daily/ weekly confluence+ agreement resistance zones.


@rogertc I paid attention to you, please give me a concern too.
Downvoting a post can decrease pending rewards and make it less visible. Common reasons:
Submit