It is important to identify and understand trends so that you can trade with rather than against them. Always remember “Trend is your Friend”. Trading in the direction of the Trend maximizes your chance of success.
Traders can identify the trend using various forms of technical analysis, including both trendlines and technical indicators. However, using a trendline is the strongest form of confirming that a trend exists. Knowing the trend also helps to avoid false buy/sell signals (or whipsaws), as some indicators like oscillators behave better in sideways trends and others like trending indicators behave better in trending markets. Hence, it can lead to a much better success rate!
- The line graph
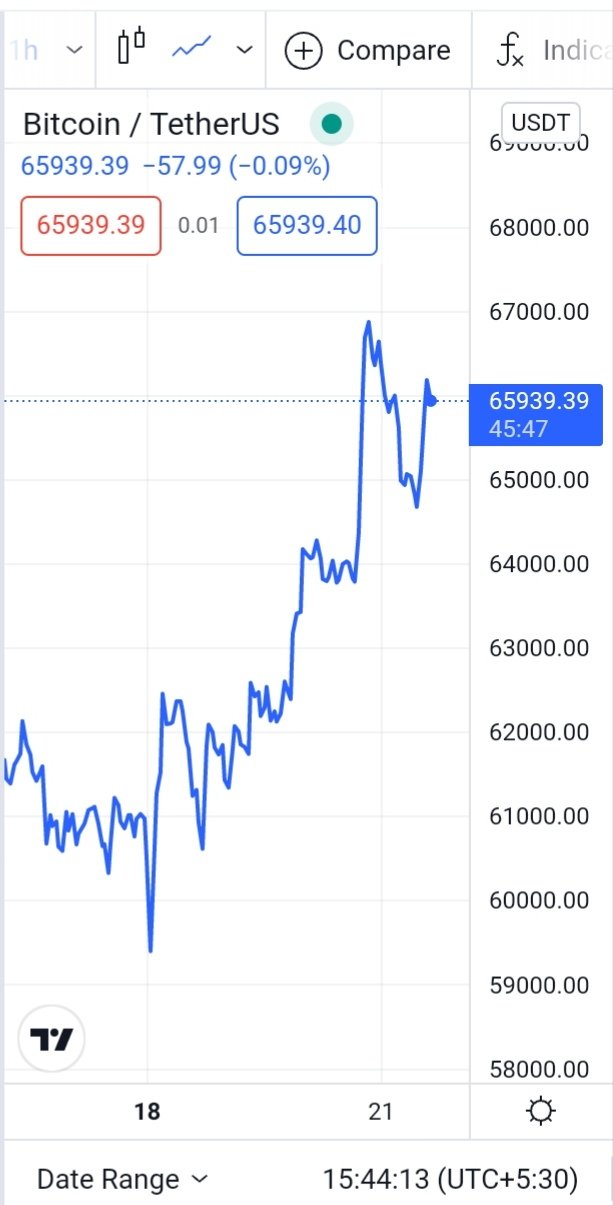
Most traders only use bars and candles when it comes to observing charts, but they completely forget about a very effective and simple tool that allows them to look through all the clutter and noise: the line graph.
The purpose of bars and candles is to provide detailed information about what is happening on your charts, but is this really necessary when it comes to identifying the overall trend? Probably not.
A trader should zoom out from time to time (at least once a week) and also switch to the line graph to get a better and clearer picture of what is currently happening. And since our only goal here is to identify the trend direction and become aware of the overall situation, the line graph is a perfect starting point.
- Trendlines
The most common way to identify trends is using trendlines, which connect a series of highs or lows.
Uptrend:
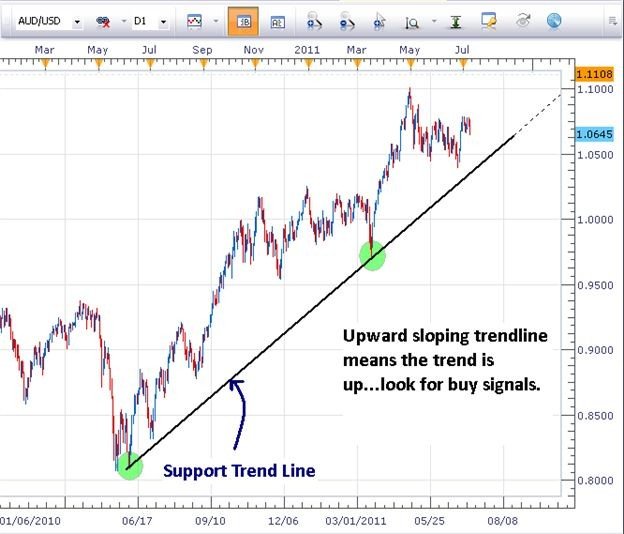
If you can connect a series of chart low points sloping upward, you have an uptrend. An uptrend is always characterized by higher highs and higher lows
Downtrend:
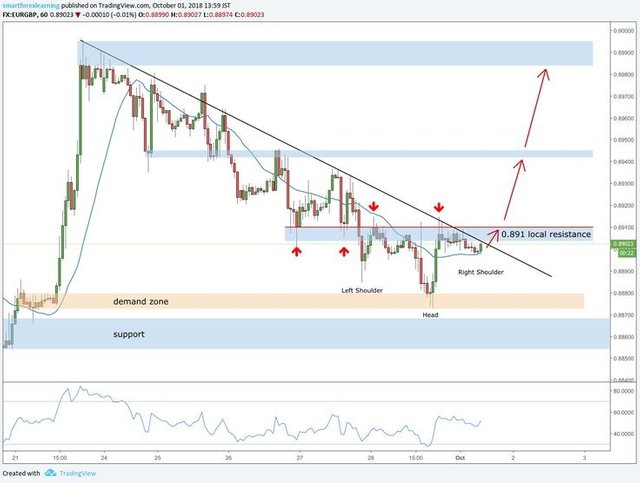
If you can connect a series of chart high points sloping downward, you have a downtrend. A downtrend is always characterized by lower highs and lower lows.
- Moving Averages
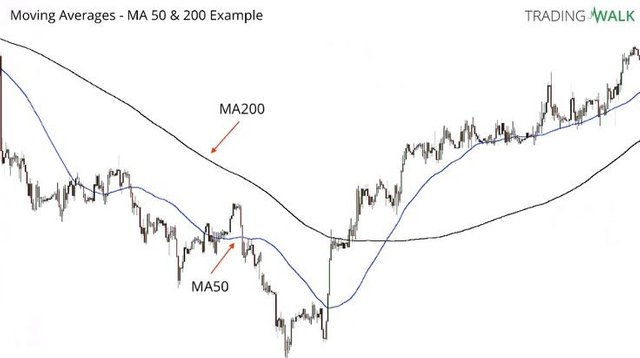
Moving averages are undoubtedly among the most popular trading tools and they are great to identify the market direction as well. However, there are a few things to be aware of when it comes to analyzing trend direction with moving averages.
The length of the moving average highly impacts when you get a signal when markets turn.
A small (fast) moving average might give a lot of early and false signals because it reacts too soon to minor price movements. On the other hand, a fast moving average can get you out early when the trend is about to change.
A slow moving average might provide signals too late. Or, it can help you ride trends longer when it filters out the noise.
Normally traders use 200 EMA to identify long term trend direction.
- ADX
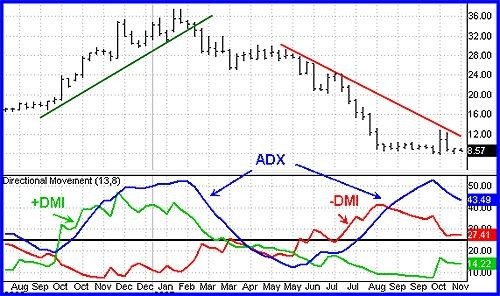
The ADX is an indicator that you could use to determine the direction of the trend and for the strength as well. The ADX indicator comes with three lines: the ADX line that tells you the strength of the trend (we deleted this line in our example, since we only want to analyze the direction of the trend), the +DI line which shows the bullish strength (green line) and the -DI line which shows the bearish strength (red line).
Take trade decision in uptrend if the +DI is above - DI and +Di should be above 25 to enter for a long and vice-versa.