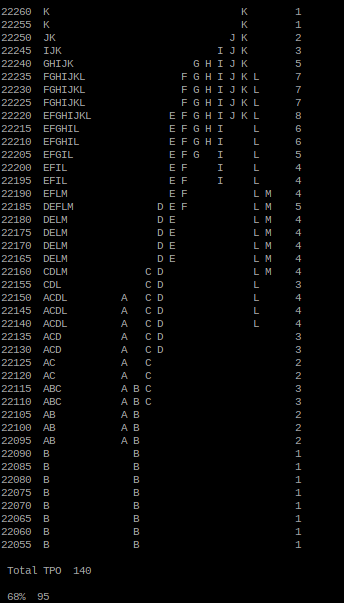
IN THIS WE FIND ONE TIME FRAMING HAPPENED FROM FROM C TO H PERIOD . BUT WHEN CLOSELY ANALYSE WE FIND D , E,F WE FIND THESE ARE NEAR TO HALFBACK AREAS THESE ARE MECHANICAL REFERENCE AREAS FROM PRICE HAS SHOOTED UP AND ALSO THIS INDICATE THE MARKET IS MOVED BY TRADERS WHO ARE ABLE TO EXECUTE THEIR TRADES AT A SPECIFIC PRICE. FROM THIS ITSELF MARKET IS MOVED BY WEAKER HANDS SO WE CAN EXPECT MARKET TO FALL TO HIT THEIR STOP LOSS AND THIS TOOK PLACE IN K AND L PERIOD.
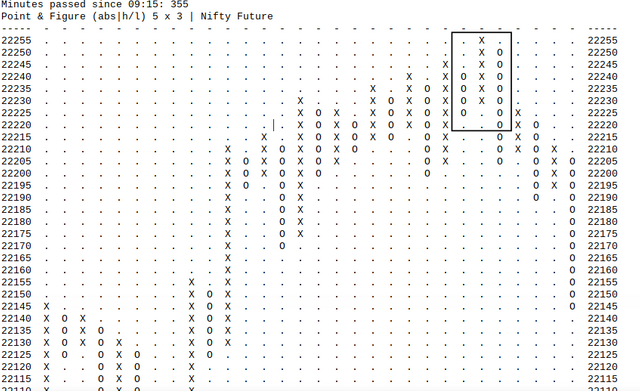
we can also find point and figure chart plotted using 1 min data and we find double bottom sell before that we also find price unable to move higher and stalling for quite longer time